IPC-TM-650 EN 2022 试验方法--.pdf - 第310页
Figure 1 Laminate Dielectric The Institute for Int erconnecting and Packaging E lectronic Circuits 2215 S anders Road • Northbrook, IL 60062-6135 Material in this T est M ethods Manual was voluntarily establis hed by T e…
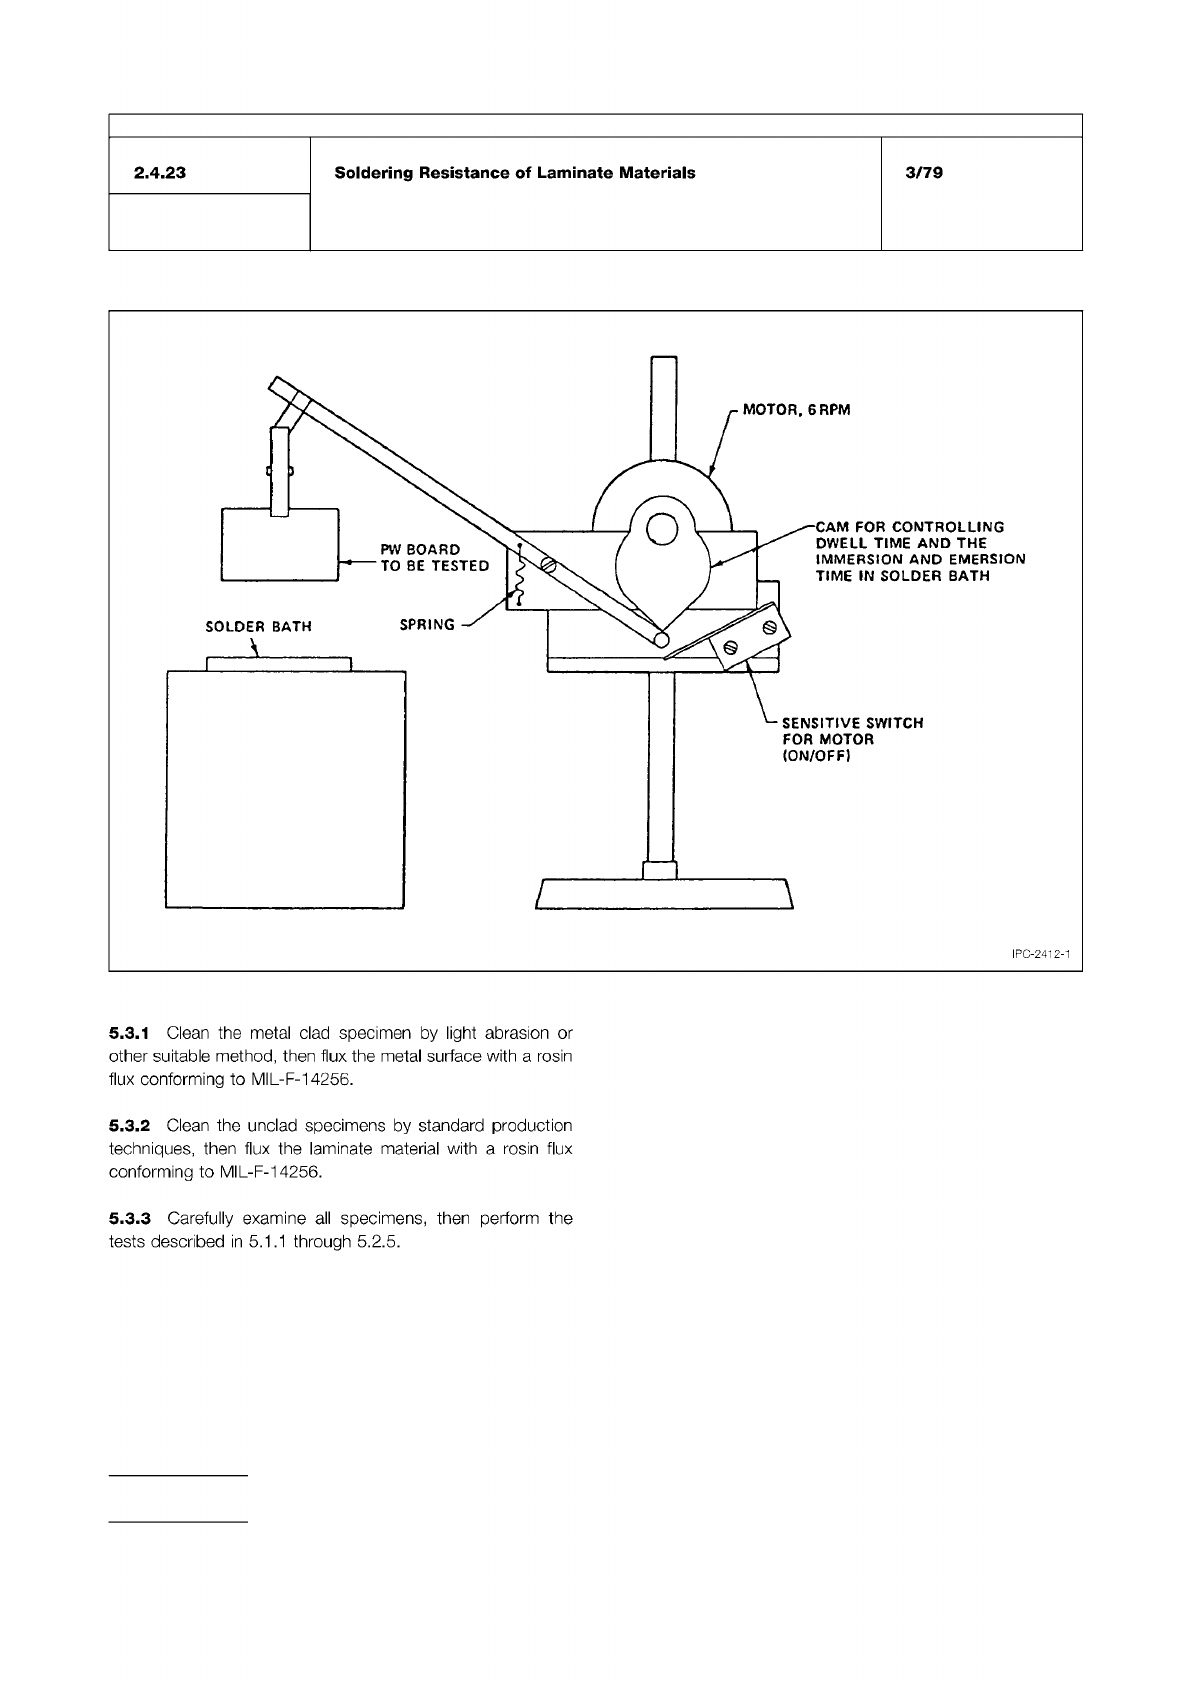
Figure 1 Suggested Dipping Device
IPC-TM-650
Number
Subject Date
Revision
Page 2 of 2
5.3.1
Clean
the
metal
clad
specimen
by
light
abrasion
or
other
suitable
method,
then
flux
the
metal
surface
with
a
rosin
flux
conforming
to
MIL-F-14256.
5.3.2
Clean
the
unclad
specimens
by
standard
production
techniques,
then
flux
the
laminate
material
with
a
rosin
flux
conforming
to
MIL-F-14256.
2.4.23
Soldering
Resistance
of
Laminate
Materials
3/79
5.3.3
Carefully
examine
all
specimens,
then
perform
the
tests
described
in
5.1.1
through
5.2.5.
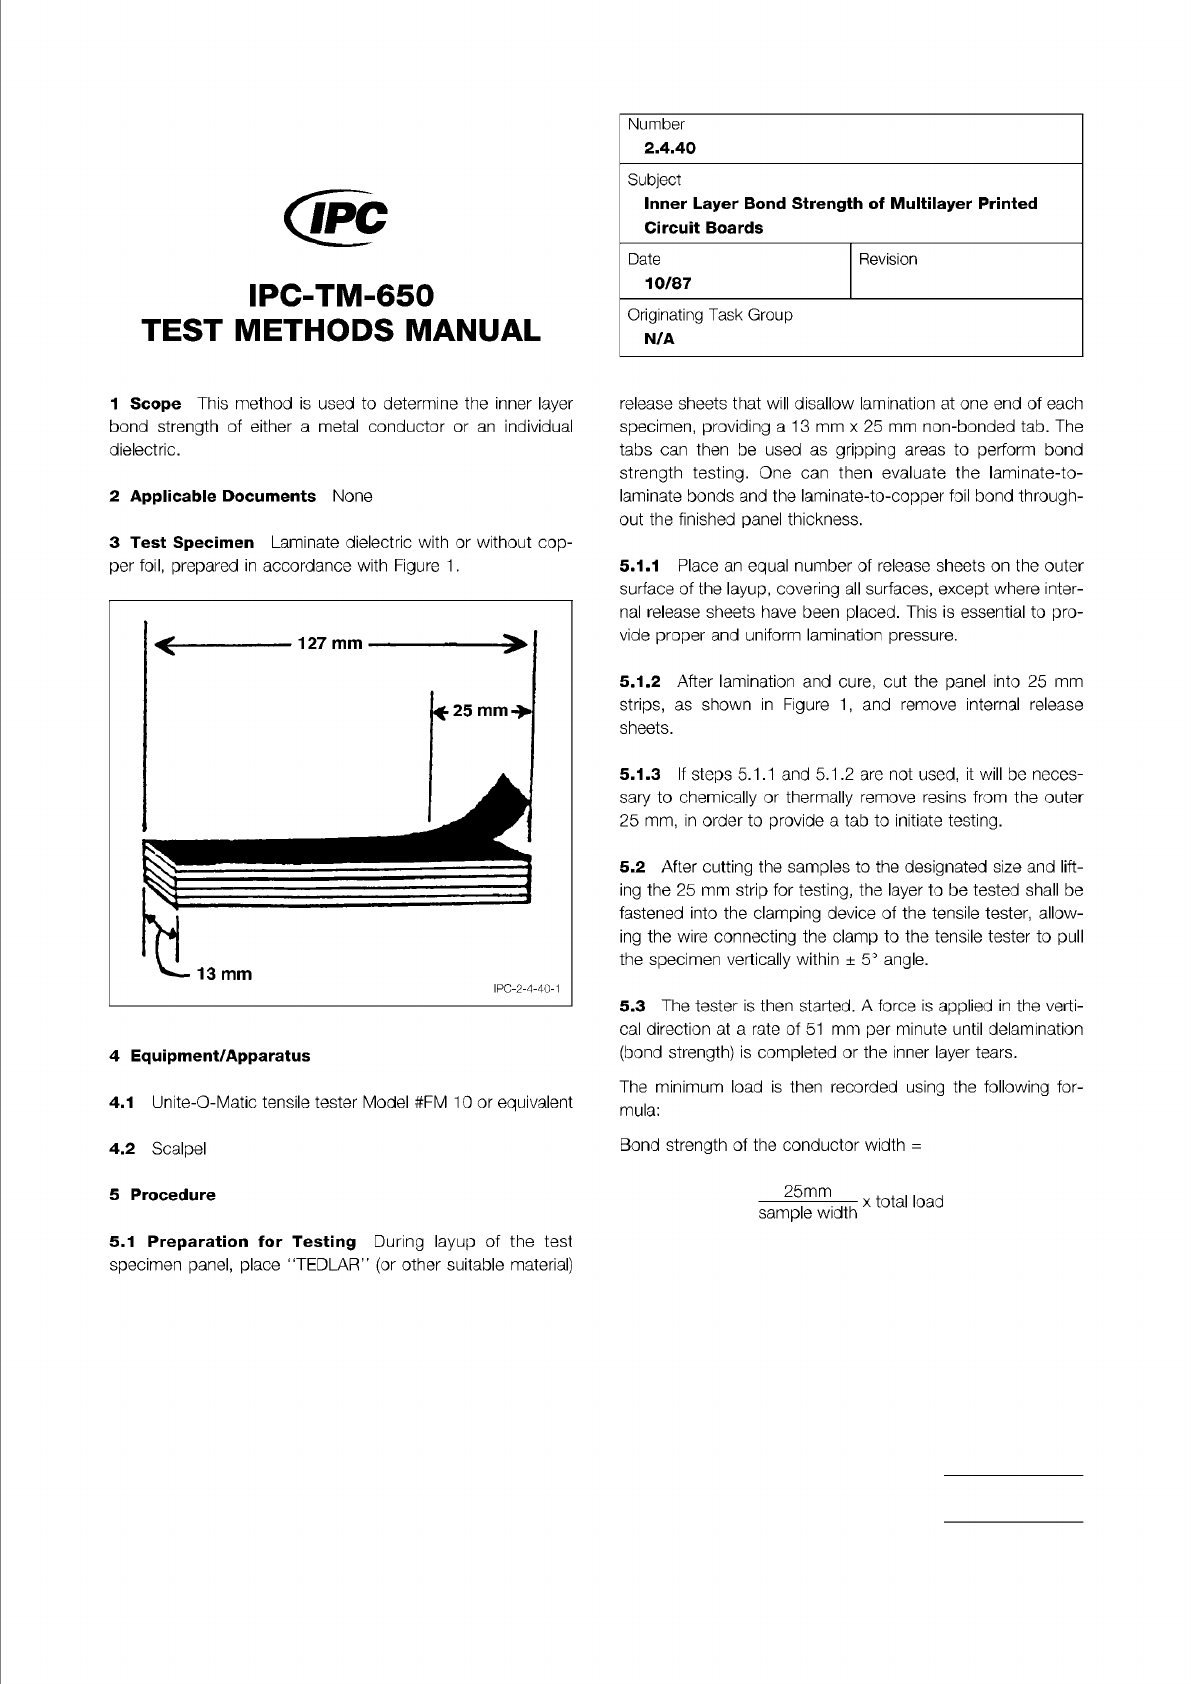
Figure 1 Laminate Dielectric
The Institute for Interconnecting and Packaging Electronic Circuits
2215 Sanders Road • Northbrook, IL 60062-6135
Material in this Test Methods Manual was voluntarily established by Technical Committees of the IPC. This material is advisory only
and its use or adaptation is entirely voluntary. IPC disclaims all liability of any kind as to the use, application, or adaptation of this
material. Users are also wholly responsible for protecting themselves against all claims or liabilities for patent infringement.
Equipment referenced is for the convenience of the user and does not imply endorsement by the IPC.
Page 1 of 1
IPC-TM-650
TEST
METHODS
MANUAL
1
Scope
This
method
is
used
to
determine
the
inner
layer
bond
strength
of
either
a
metal
conductor
or
an
individual
dielectric.
2
Applicable
Documents
None
3
Test
Specimen
Laminate
dielectric
with
or
without
cop¬
per
foil,
prepared
in
accordance
with
Figure
1
.
4
Equipment/Apparatus
4.1
Unite-O-Matic
tensile
tester
Model
#FM
10
or
equivalent
4.2
Scalpel
5
Procedure
Number
2.4.40
Subject
Inner
Layer
Bond
Strength
of
Multilayer
Printed
Circuit
Boards
Date
Revision
10/87
Originating
Task
Group
N/A
release
sheets
that
will
disallow
lamination
at
one
end
of
each
specimen,
providing
a
13
mm
x
25
mm
non-bonded
tab.
The
tabs
can
then
be
used
as
gripping
areas
to
perform
bond
strength
testing.
One
can
then
evaluate
the
laminate-to-
laminate
bonds
and
the
laminate-to-copper
foil
bond
through¬
out
the
finished
panel
thickness.
5.1.1
Place
an
equal
number
of
release
sheets
on
the
outer
surface
of
the
layup,
covering
all
surfaces,
except
where
inter¬
nal
release
sheets
have
been
placed.
This
is
essential
to
pro¬
vide
proper
and
uniform
lamination
pressure.
5.1.2
After
lamination
and
cure,
cut
the
panel
into
25
mm
strips,
as
shown
in
Figure
1
,
and
remove
internal
release
sheets.
5.1.3
If
steps
5.1.1
and
5.1
.2
are
not
used,
it
will
be
neces¬
sary
to
chemically
or
thermally
remove
resins
from
the
outer
25
mm,
in
order
to
provide
a
tab
to
initiate
testing.
5.2
After
cutting
the
samples
to
the
designated
size
and
lift¬
ing
the
25
mm
strip
for
testing,
the
layer
to
be
tested
shall
be
fastened
into
the
clamping
device
of
the
tensile
tester,
allow¬
ing
the
wire
connecting
the
clamp
to
the
tensile
tester
to
pull
the
specimen
vertically
within
±
5°
angle.
5.3
The
tester
is
then
started.
A
force
is
applied
in
the
verti¬
cal
direction
at
a
rate
of
51
mm
per
minute
until
delamination
(bond
strength)
is
completed
or
the
inner
layer
tears.
The
minimum
load
is
then
recorded
using
the
following
for¬
mula:
Bond
strength
of
the
conductor
width
二
25mm
sample
width
x
total
load
5.1
Preparation
for
Testing
During
layup
of
the
test
specimen
panel,
place
llTEDLAR"
(or
other
suitable
material)
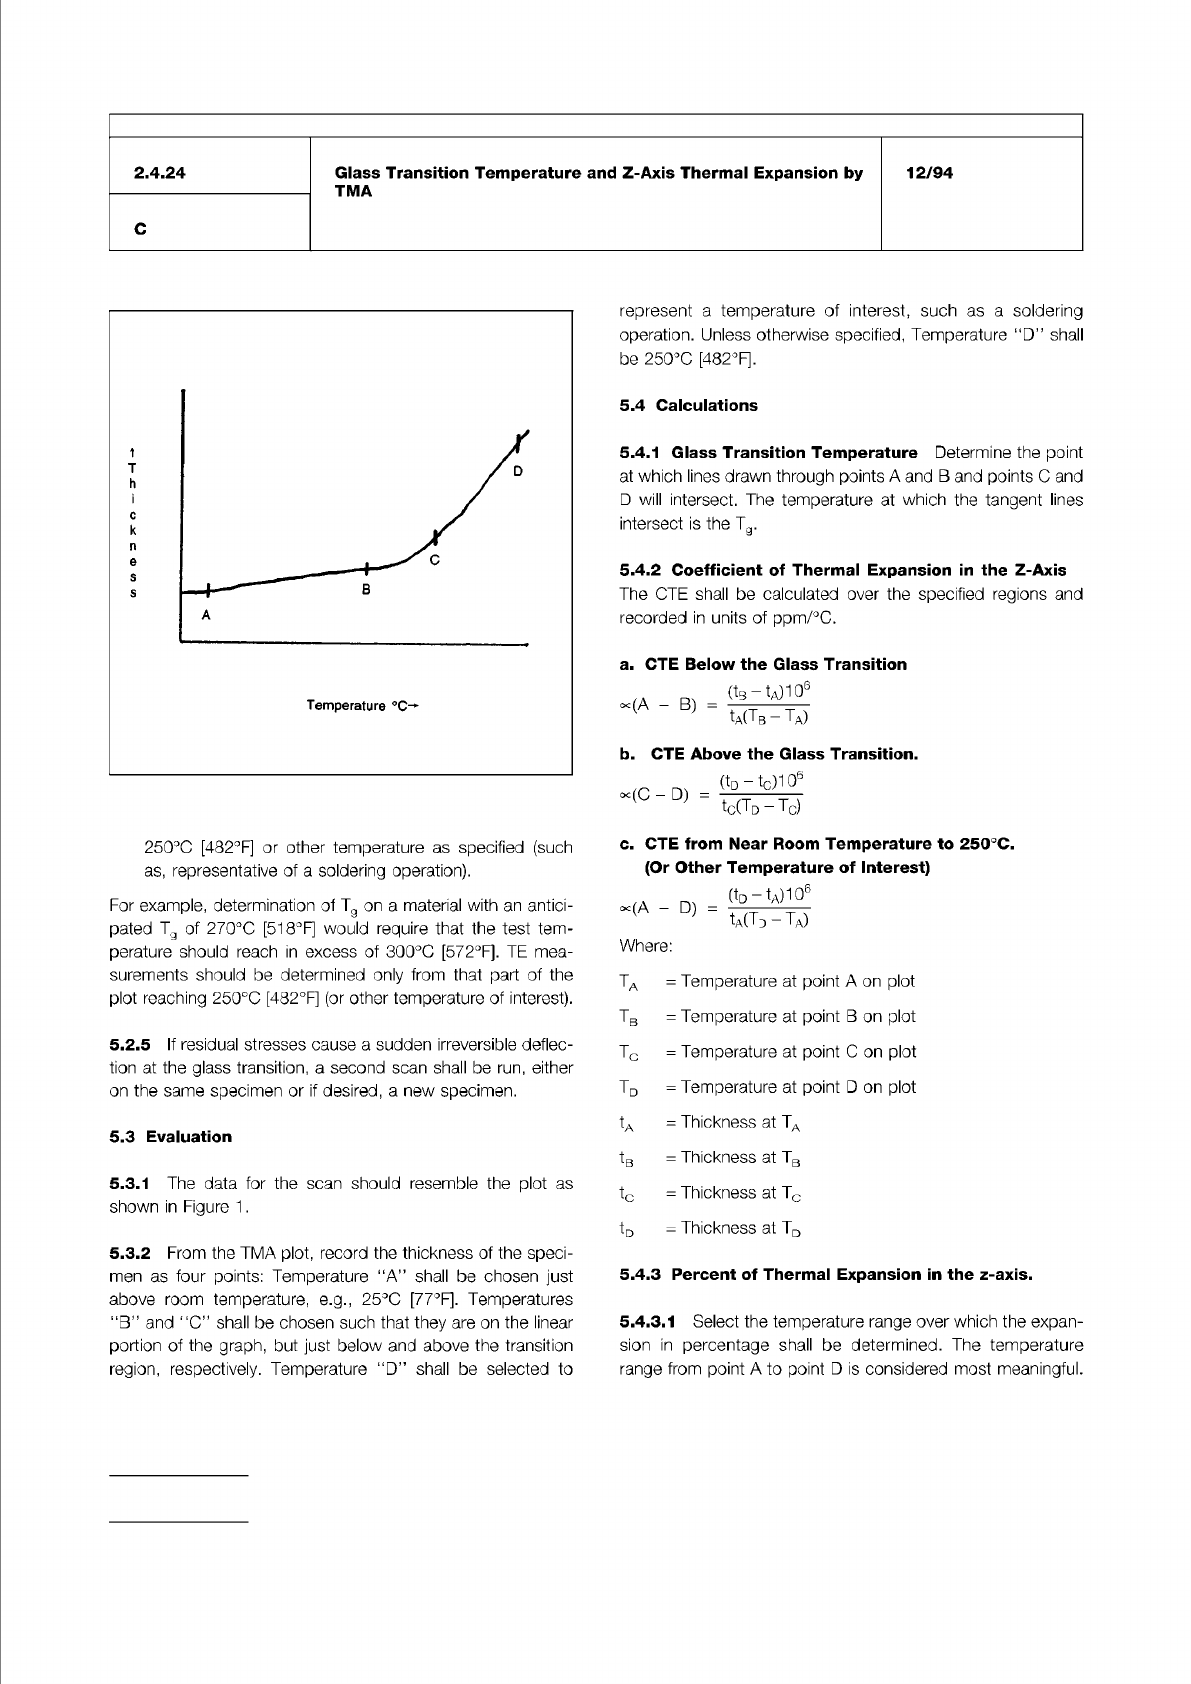
Figure 1
IPC-TM-650
Number
Subject Date
Revision
Page 2 of 3
2.4.24
Glass
Transition
Temperature
and
Z-Axis
Thermal
Expansion
by
TMA
12/94
C
Temperature
℃
-*■
250℃
[482°F]
or
other
temperature
as
specified
(such
as,
representative
of
a
soldering
operation).
For
example,
determination
of
Tg
on
a
material
with
an
antici¬
pated
Tg
of
270℃
[518°F]
would
require
that
the
test
tem¬
perature
should
reach
in
excess
of
300℃
[572°F].
TE
mea¬
surements
should
be
determined
only
from
that
part
of
the
plot
reaching
250℃
[482°F]
(or
other
temperature
of
interest).
5.2.5
If
residual
stresses
cause
a
sudden
irreversible
deflec¬
tion
at
the
glass
transition,
a
second
scan
shall
be
run,
either
on
the
same
specimen
or
if
desired,
a
new
specimen.
5.3
Evaluation
5.3.1
The
data
for
the
scan
should
resemble
the
plot
as
shown
in
Figure
1
.
5.3.2
From
the
TMA
plot,
record
the
thickness
of
the
speci¬
men
as
four
points:
Temperature
"A''
shall
be
chosen
just
above
room
temperature,
e.g.,
25℃
[77°F]-
Temperatures
“B”
and
<lC"
shall
be
chosen
such
that
they
are
on
the
linear
portion
of
the
graph,
but
just
below
and
above
the
transition
region,
respectively.
Temperature
"D”
shall
be
selected
to
represent
a
temperature
of
interest,
such
as
a
soldering
operation.
Unless
otherwise
specified,
Temperature
"D”
shall
be
250℃
[482°F].
5.4
Calculations
5.4.1
Glass
Transition
Temperature
Determine
the
point
at
which
lines
drawn
through
points
A
and
B
and
points
C
and
D
will
intersect.
The
temperature
at
which
the
tangent
lines
intersect
is
the
Tg.
5.4.2
Coefficient
of
Thermal
Expansion
in
the
Z-Axis
The
CTE
shall
be
calculated
over
the
specified
regions
and
recorded
in
units
of
ppm/℃.
a.
CTE
Below
the
Glass
Transition
c<(A
—
B)
=
WTb
-
ta)
b.
CTE
Above
the
Glass
Transition.
x(C
-
D)
Od
-
砂
06
忆(丁口
一
%)
c.
CTE
from
Near
Room
Temperature
to
250℃.
(Or
Other
Temperature
of
Interest)
oc(A
-
D)
=
«D
-
tA*。'
^a(Td
-
Ta)
Where:
Ta
=
Temperature
at
point
A
on
plot
Tb
=
Temperature
at
point
B
on
plot
Tc
=
Temperature
at
point
C
on
plot
Td
=
Temperature
at
point
D
on
plot
tA
=
Thickness
at
TA
tB
=
Thickness
at
TB
tc
=
Thickness
at
Tc
tD
二
Thickness
at
TD
5.4.3
Percent
of
Thermal
Expansion
in
the
z-axis.
5.4.3.1
Select
the
temperature
range
over
which
the
expan¬
sion
in
percentage
shall
be
determined.
The
temperature
range
from
point
A
to
point
D
is
considered
most
meaningful.