IPC-TM-650 EN 2022 试验方法--.pdf - 第448页
Figure 8 Brass or Aluminum Base P late for C lamping the Base Cards and Co nnecting Launcher B odies to t he Base Card IPC-TM-650 Page 16 of 25 Number 2.5.5.5 Subject Stripline Test for Permittivity and Loss Tangent (Die…
V1(f) and V2(t) is a respective ordered frequency pair A1(f),
φ1(f) and A2(f), φ2(f).
The attenuation, Att(f), and phase constant, β(f), are com-
puted with Equations 5-10 and 5-11.
Γ(,) = α(,) + jβ(,) =
−
1
l
1
– l
2
1n
(
A
1
(,)
A
2
(,)
)
+ j
φ
1
(,) − φ
2
(,)
l
1
− l
2
[5-10]
Att(,) = 20 log (e
Re(Γ(,)
)
β(,) = Im (Γ(F))
[5-11]
5.3.6.3 SPP Broadband Complex Permittivity Extraction
5.3.6.3.1 Frequency Dependent Line Parameters
A 2D
field solver is used to calculate R(f), L(f), C(f), and G(f) per unit
length based on the actual cross sectional dimensions, the
metal resistivity ρ, and low frequency ε
r
and tanδ outlined
above. A 2D solver that assures a causally related calculation
of L-R and C-G is recommended. The initial calculation can
contain a few initial points for ε
r
and tanδ that are used as
starting values for the high-frequency range, for example
3 GHz to 20 GHz. Based on the calculated R(f), L(f), C(f), and
G(f), the attenuation and phase constant are calculated from
Equation 5-12.
Γ(,) = α(,) + jβ(,) =
√
(R + jωL)(G + jωC)
[5-12]
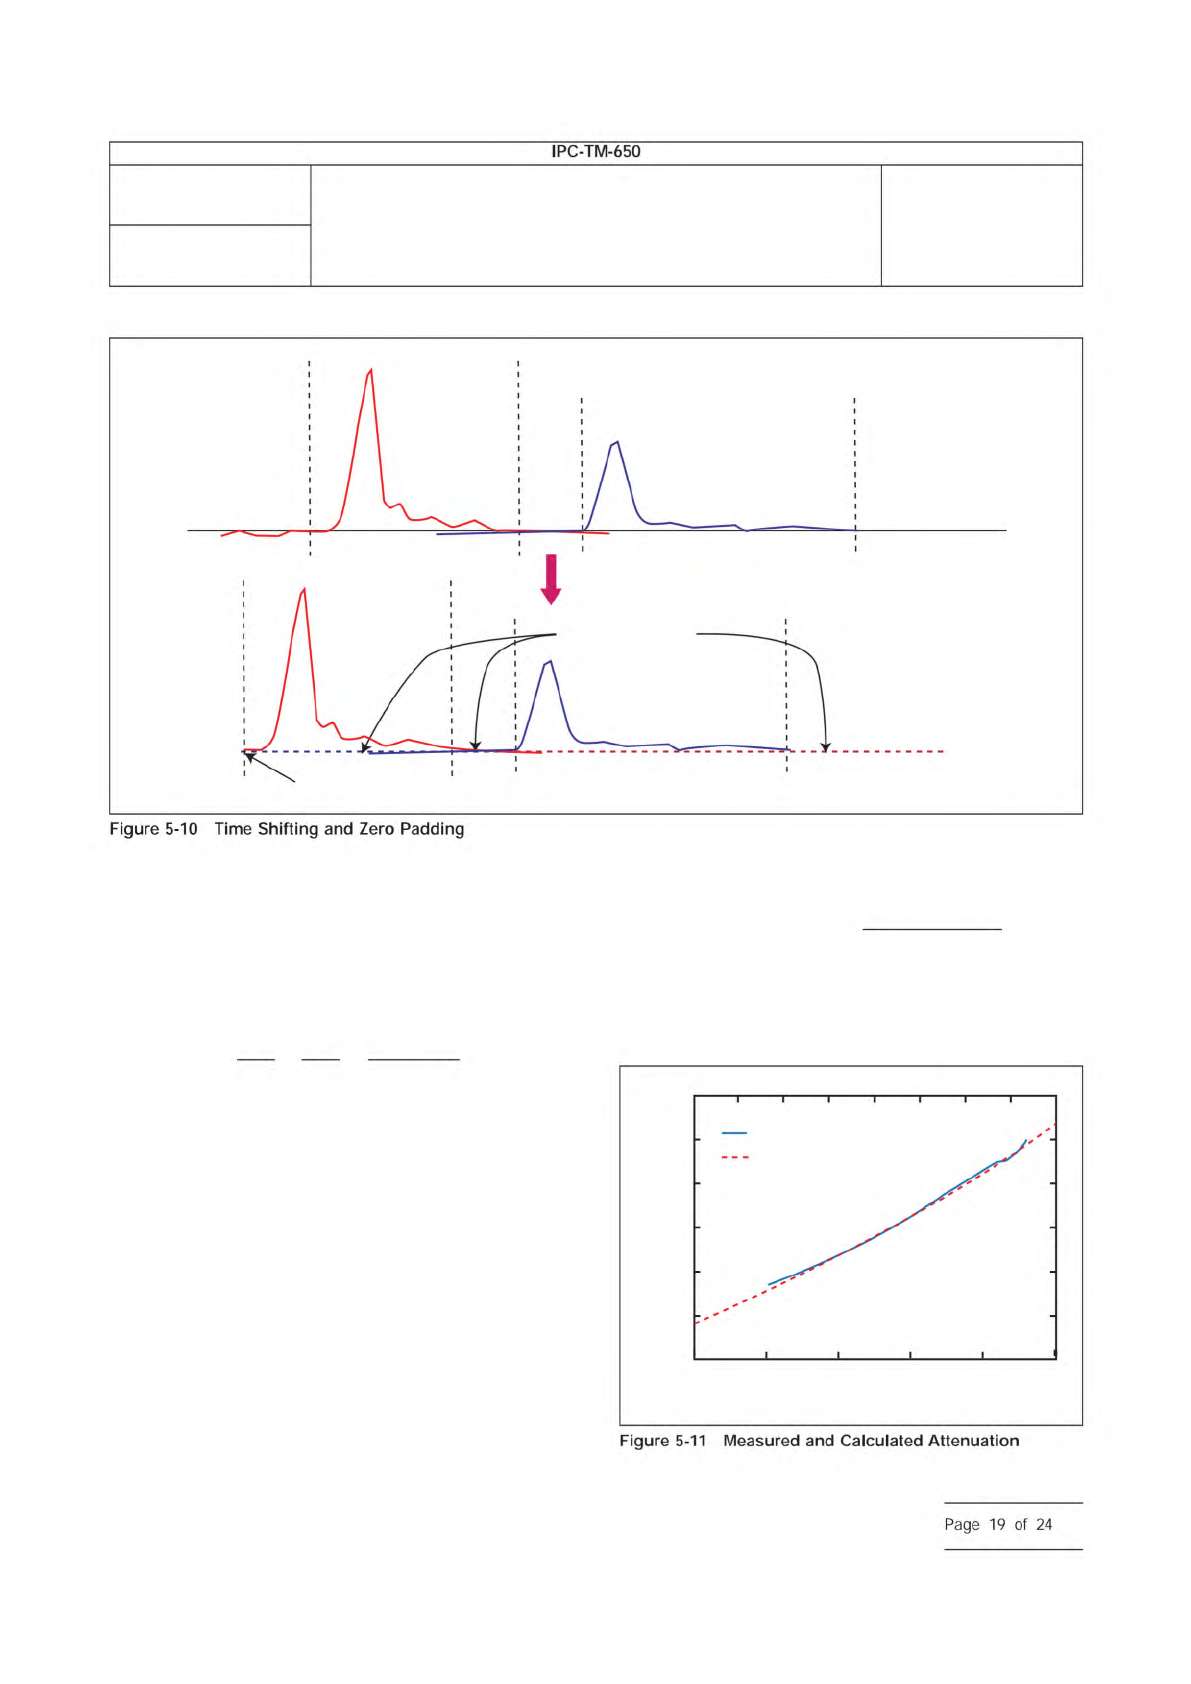
The measured and calculated attenuation and phase are
compared to the measured values as shown in Figure 5-11
and Figure 5-12.
IPC-25512-5-10
0V, 0S
Zero Padded
IPC-25512-5-11
Attenuation (dB/cm)
0.05
0.1
0.2
0.5
1
2
5
1 2 5 10 20 50
Frequency (GHz)
Measured
Calculated
Number
2.5.5.12
Subject
Test Methods to Determine the Amount of Signal Loss on
Printed Boards
Date
07/12
Revision
A
IPC-TM-650
—
Figure
5-10
Time
Shifting
and
Zero
Padding
Figure
5-11
Measured
and
Calculated
Attenuation
Page
19
of
24
Figure
8 Brass or Aluminum Base Plate for Clamping the Base Cards and Connecting Launcher Bodies to the Base Card
IPC-TM-650
Page 16 of 25
Number
2.5.5.5
Subject
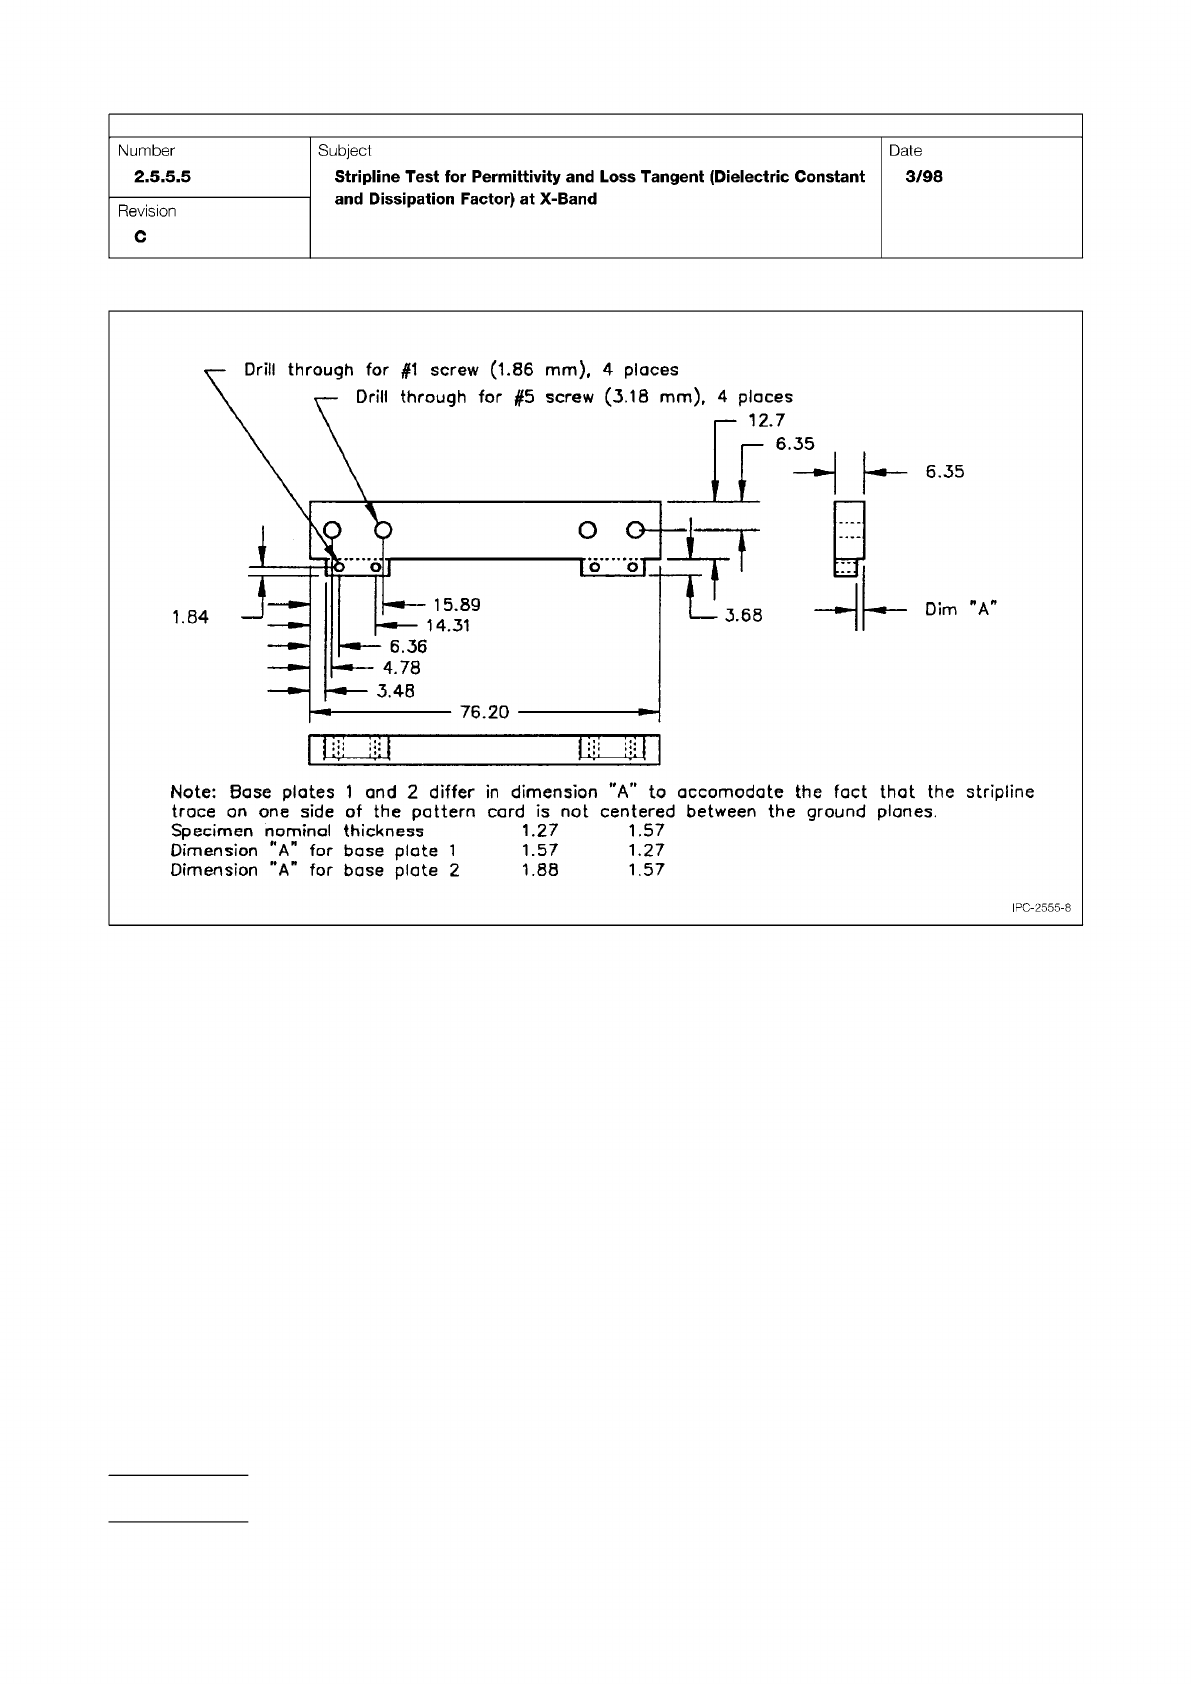
Stripline
Test
for
Permittivity
and
Loss
Tangent
(Dielectric
Constant
and
Dissipation
Factor)
at
X-Band
Date
3/98
Revision
C
6.35
o
L£
Dim
"A
76.20
Drill
through
for
#1
screw
(1.86
mm),
4
places
Drill
through
for
#5
screw
(3.18
mm),
4
places
12.7
15.89
14.31
-
•-
6.36
4.78
—
3.48
stripline
Note:
Base
plates
1
and
2
differ
in
dimension
"A”
to
accomodate
the
fact
that
the
trace
on
one
side
of
the
pattern
card
is
not
centered
between
the
ground
planes.
Specimen
hominal
thickness
1.27
1.57
Dimension
“A”
for
base
plate
1
1.57
1.27
Dimension
“A"
for
base
plate
2
L88
1.57
IPC-2555-8
The same technique can be used for extracting the resistive
and dielectric losses in the presence of metal roughness and
dielectric inhomogeneities and for differential wiring.
5.4 SET2DIL Procedure
This specification outlines the
fundamental principles behind SET2DIL; the exact method will
be instrument-dependent. Vendors providing SET2DIL capa-
bility are responsible for ensuring correlation between stan-
dard SDD21 measurements (VNA) and their implementation of
SET2DIL.
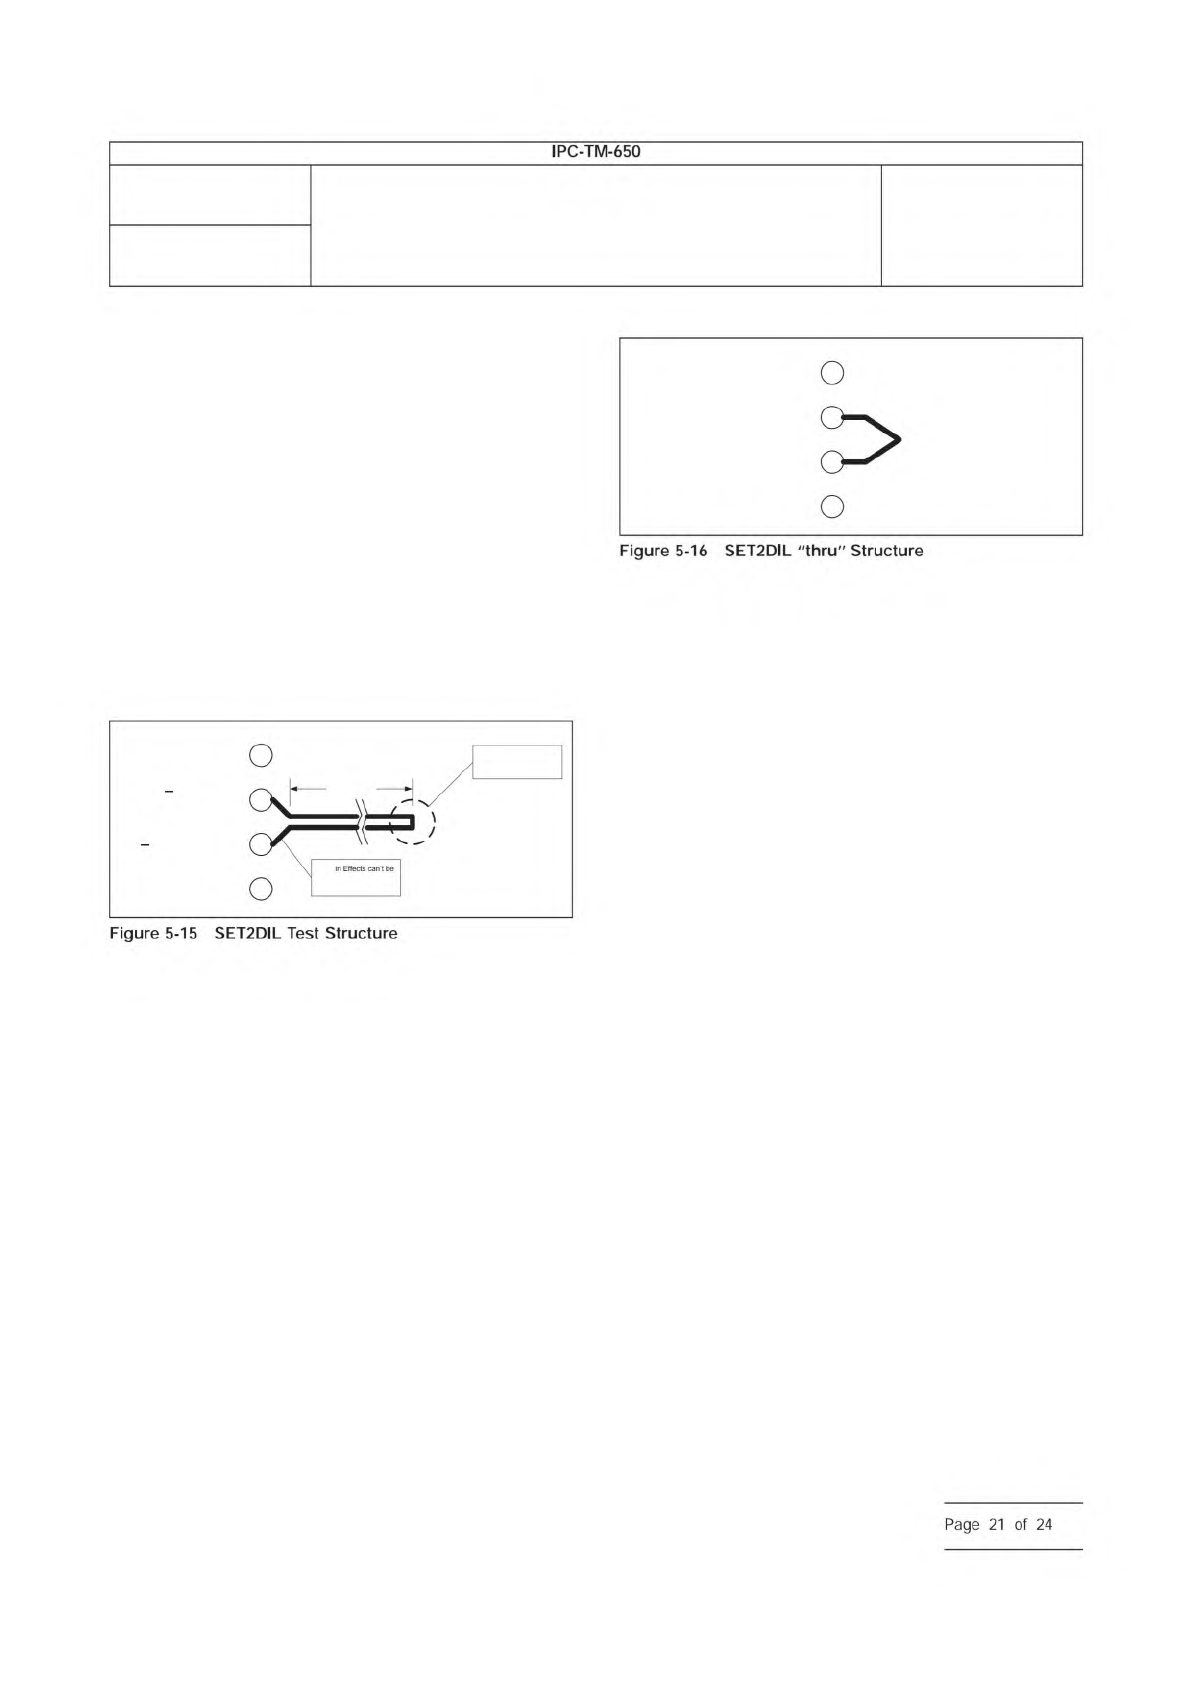
5.4.1 SET2DIL Structure
The SET2DIL structure is a
101.6 mm [4.0 in] representative piece of the differential pair
(or single-ended signal) being characterized (see Figure 5-15).
It has an effective length of 203.2 mm [8.0 in]. A ‘‘thru’’ struc-
ture is used as a reference (see Figure 5-16).
5.4.2 SET2DIL Measurement
A TDR pulse is injected into
‘‘q1’’ while the waveforms at q1 and q2 are monitored. The
q1 waveform will represent single-ended impedance with the
far end cross talk (FEXT) pulse superimposed on that. Like-
wise, the q2 waveform will represent the near end cross talk
(NEXT) pulse with the TDT pulse superimposed on that (see
Figure 5-17).
5.4.3 SET2DIL TDD21 Extraction
The TDT pulse is
extracted from the q2 waveform, and the FEXT pulse is
extracted from the q1 waveform. FEXT is subtracted from TDT
to form TDD21. A detailed description of the waveform
manipulation is available as the 2010 DesignCon paper
‘‘SET2DIL: Method to Derive Differential Insertion Loss from
Single-Ended TDR/TDT Measurements.’’ Figure 5-18 shows
the extracted waveforms and the resultant TDD21.
5.4.4 SET2DIL SDD21 Calculation
The FFT of the deriva-
tive of TDD21 is divided by the FFT of the derivative of the
‘‘thru’’ waveforms to calculate SDD21 of the SET2DIL struc-
ture. Figure 5-19 shows the time and frequency domain wave-
forms (SET2DIL frequency domain results compared to VNA
measurements on the right). SDD21 as a function of fre-
quency can then be compared to expected values to deter-
mine if the printed board construction is adequate to meet the
insertion loss requirements of the design.
IPC-25512-5-15
G
+
G
q1 excitation/
measurement
DUT/2 (4")
q2 measurement
DUT looped back
at end
Lead-
de-embedded;
must be minimized
IPC-25512-5-16
Ref Structure
(thru)
G
-
+
G
q1: excitation
q2: measurement
Number
2.5.5.12
Subject
Test Methods to Determine the Amount of Signal Loss on
Printed Boards
Date
07/12
Revision
A
IPC-TM-650
—
o
o
Figure
5-16
SET2DIL
"thru"
Structure
Page
21
of
24