IPC-TM-650 EN 2022 试验方法--.pdf - 第423页
5.2.1.3 Test Specimen Measurement Process This pro- cedure will measure two interconnection test structures of dif- ferent len gths. The propagation delay is calculated from the measurements of the difference in TDR refl…
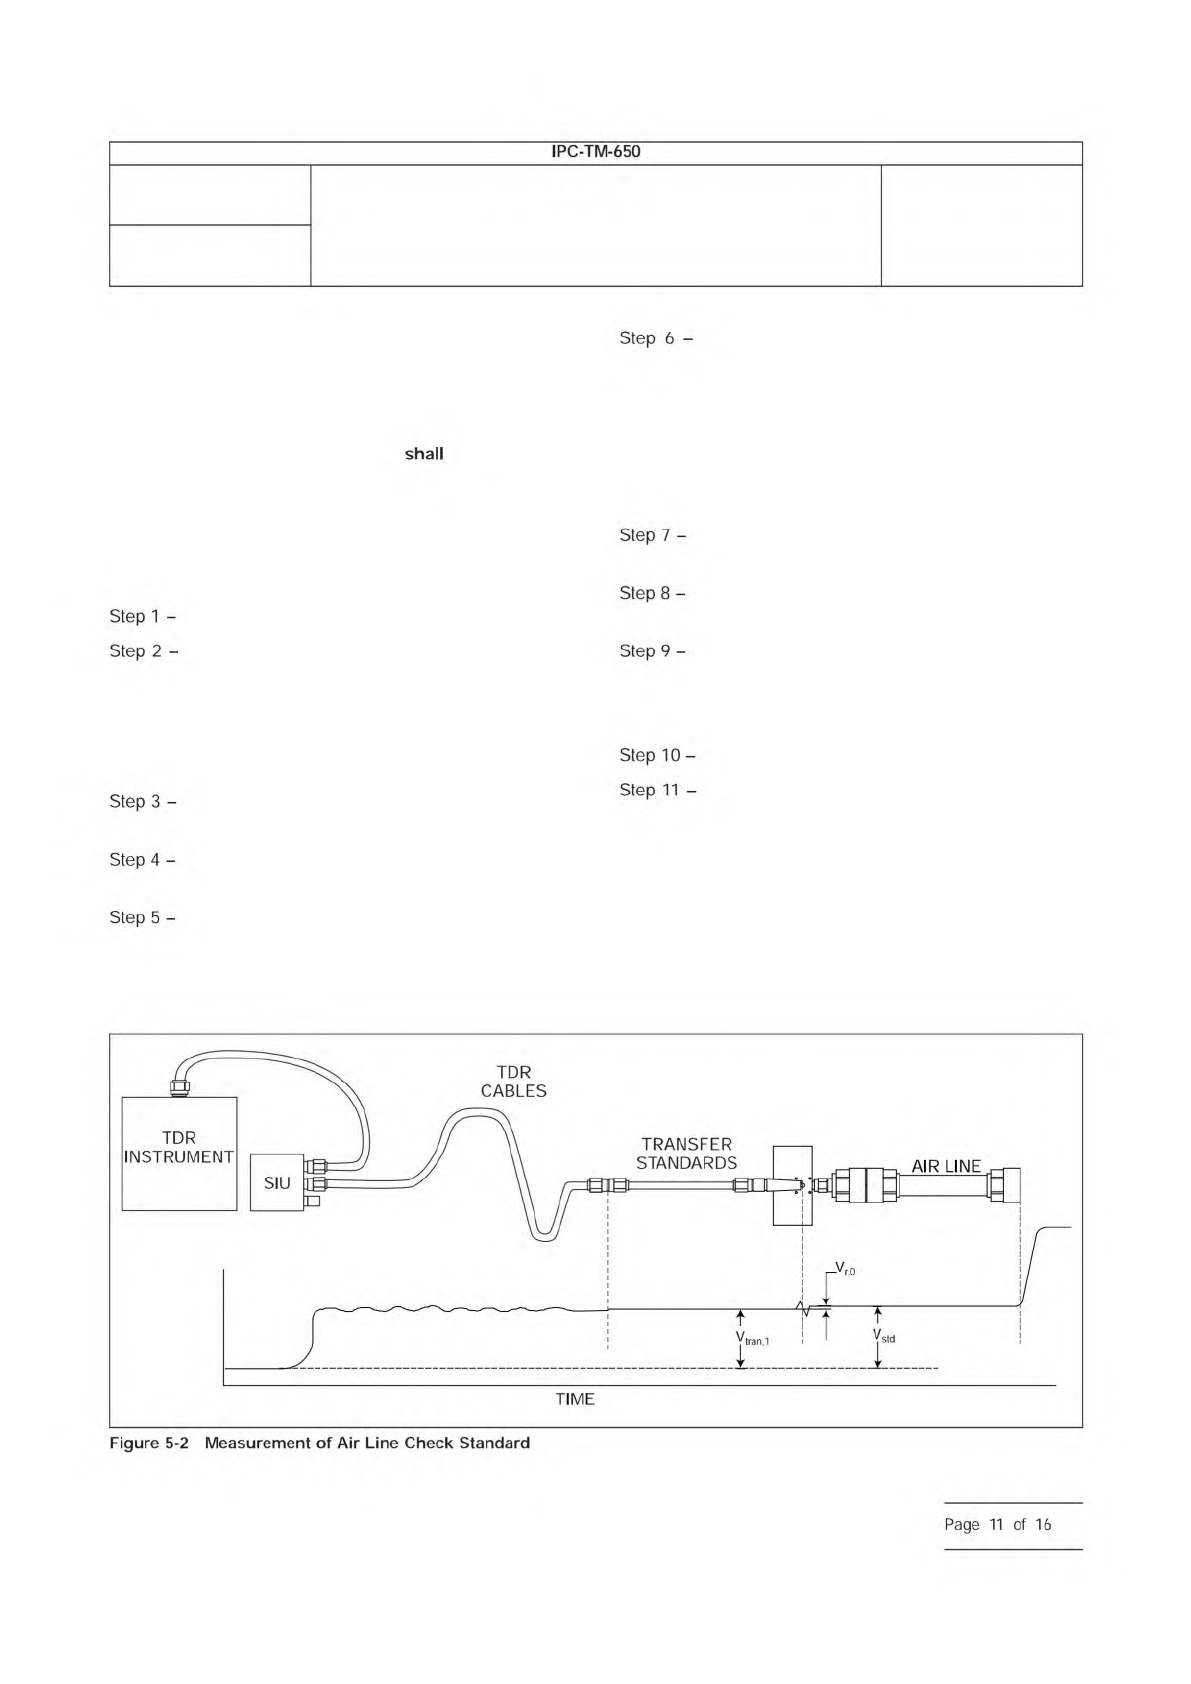
5.2.1.2 Verification Field Check
The method includes a
verification procedure to test the success of the measurement
set-up in determining propagation delay. The verification pro-
cedure follows the same steps used when characterizing test
specimens, but uses known and precise delay verification ele-
ments (as described in 4.3.7.) The user
perform this field
check prior to reporting delay results from the test specimens.
The user must fabricate their own transition cards that allow
electrical connection to the end of the coaxial air lines using
the probes of the measurement set-up. Figure 5-2 shows the
probe contacting a transition to coaxial adapter.
Turn on the TDR source and enable triggering.
Connect the probe-to-coax adapter to one end of
the longer air line check standard, leaving the opposite end
open circuit. For beadless air lines, this requires the addition
of an open circuit coax adapter at the far end in order to hold
the center conductor in place. As with all coax connections,
use the appropriate connection torque (see 4.3.1).
Connect the probe to the contact pads of the tran-
sition adapter.
Adjust the waveform epoch to capture the reflection
signal from the far end of the longer open circuit air line.
Measure the arrival time of the reflection signal from
the open circuit by testing when the reflection signal crosses
V
REF
as defined above for the user-selected value of x. Record
the arrival time value as t
T1
.
Connect the same probe-to-coax adapter used
above in Step 2 to one end of the shorter air line check stan-
dard, leaving the opposite end open circuit. For beadless air
lines, this requires the addition of an open circuit coax adapter
at the far end in order to hold the center conductor in place.
Use the same open circuit coax adapter used in Step 2. As
with all coax connections, use the appropriate connection
torque (see 4.3.1).
Connect the probe to the contact pads of the tran-
sition adapter.
Adjust the waveform epoch to capture the reflection
signal from the far end of the shorter open circuit air line.
Measure the arrival time of the reflection signal from
the open circuit by testing when the reflection signal crosses
V
REF
as defined above for the user-selected value of x. Record
the arrival time value as t
T2
.
Calculate the propagation time t
p
= t
T1
- t
T2
.
Compare t
p
to the difference in delay values pro-
vided by the air line manufacturer or calibration lab, and test
whether or not the measurement system t
p
agrees with the
standards to within the uncertainty target of the measurement
system or desired uncertainty required by the test specimens.
The propagation time will not be known to contain a better
resolution than that established in 4.1.2.
IPC-25511-5-2
Number
2.5.5.11
Subject
Propagation Delay of Lines on Printed Boards by TDR
Date
04/2009
Revision
SIU
TIME
TDR
INSTRUMENT
Step
1
-
Step
2
-
Step
3
-
Step
4
-
Step
5
-
Step
6
-
Step
7
-
Step
8
-
Step
9
-
Step
10
-
Step
11
-
Figure
5-2
Measurement
of
Air
Line
Check
Standard
IPC-TM-650
—
Page
11
of
16
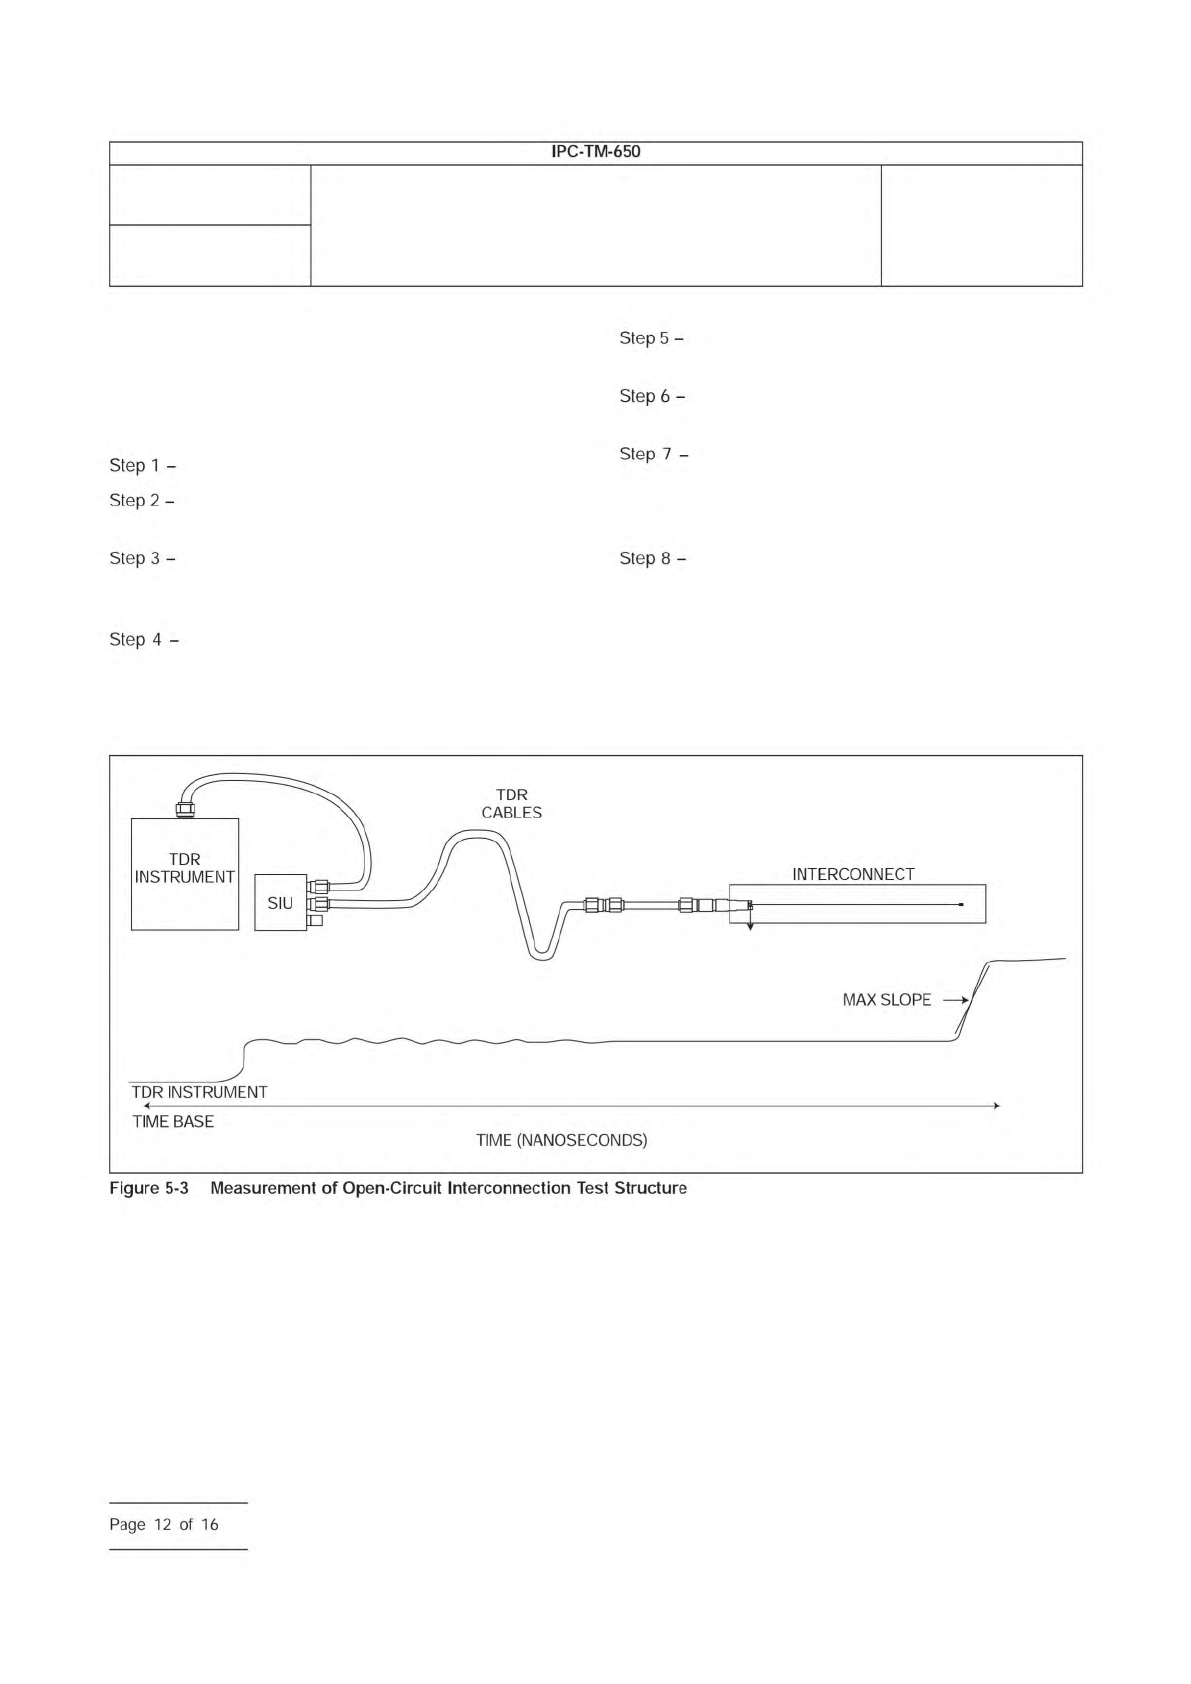
5.2.1.3 Test Specimen Measurement Process
This pro-
cedure will measure two interconnection test structures of dif-
ferent lengths. The propagation delay is calculated from the
measurements of the difference in TDR reflections from the
two test structures that differ in physical and electrical length.
Turn on the TDR source and enable triggering.
Connect the probe to the contact pads of the longer
interconnection test structure.
Adjust the waveform epoch to capture the reflection
signal from the far end of the longer test line. Figure 5-3
shows the case for an open circuit test structure.
Measure the arrival time of the reflection signal by
testing when the reflection signal crosses V
REF
as defined
above for the user-selected value of x. Record the arrival time
value as t
T1
.
Connect the probe to the contact pads of the shorter
interconnection test structure.
Adjust the waveform epoch to capture the reflection
signal from the far end of the shorter test line.
Measure the arrival time of the reflection signal by
testing when the reflection signal crosses V
REF
as defined
above for the user-selected value of x. Record the arrival time
value as t
T2
.
Calculate and record the Propagation Delay for this
test structure pair:
t
d
= t
p
/ 2L
p
where the propagation time is t
p
= t
T1
- t
T2
and the propaga-
tion length is the difference in the physical lengths of the test
structures, L
p
= L
1
- L
2
.
IPC-25511-5-3
Number
2.5.5.11
Subject
Propagation Delay of Lines on Printed Boards by TDR
Date
04/2009
Revision
IPC-TM-650
Step
1
-
Step
2
-
Step
3
-
Step
4
-
Step
5
-
Step
6
-
Step
7
-
Step
8
-
TDR
INSTRUMENT
<
TIME
BASE
TIME
(NANOSECONDS)
Figure
5-3
Measurement
of
Open-Circuit
Interconnection
Test
Structure
Page
12
of
16

6 Special Considerations and Notes
6.1 General
6.1.1 Quality Control
Measurements for manufacturing
control are performed to identify and correct process or mate-
rials problems occurring during a manufacturing run, as well
as to assure that a product will perform electrically as
designed. To facilitate the large number of measurements
required in a production environment, and to maximize mea-
surement repeatability and reproducibility between different
operators and test systems, it is particularly useful to auto-
mate the TDR calibration and measurement by using com-
puter control. This can be easily achieved using a computer
and suitable automation equipment, resulting in access to suf-
ficient repeated measurements to track the statistics of
parameter variation.
The following list provides examples of parameter variations
detectable by TDR, and that are evidence of process or mate-
rials problems:
a. Over/under-etching (line width problems)
b. Over/under-plating (line width and thickness problems)
c. Permittivity of the dielectric
d. Thickness of the dielectric
e. Degradation from excessive heating and humidity
f. Damage from excessive pressure during the multilayer pro-
cess
g. Variations in the laminate glass-to-resin content
h. Variations in additional coatings applied to the PB surface,
e.g., solder mask
Measurement repeatability is described in IPC-TM-650,
Method 1.9, ‘‘Measurement Precision Estimation for Variables
Data.’’ Method 1.9 also describes a process to evaluate the
reproducibility of a measurement system for multiple opera-
tors, on different days, and when using different instruments.
This evaluation process should be followed and a precision-
to-tolerance ratio acceptable to the customer should be
obtained.
6.1.2 Single-Ended and Differential Lines
Increased
performance requirements for computer and other electronic
products often demand even greater signal fidelity, time pre-
cision, and noise immunity than can be obtained with a single-
ended transmission line. A single-ended transmission line is a
transmission line design consisting of a single signal conduc-
tor placed over one ground plane, as in a microstrip, or
between two ground planes, as in a stripline. Single-ended
lines may be called unbalanced transmission lines. Differential
lines are used to increase signal fidelity with improved time
precision and increased noise immunity to common-mode
sources. Differential lines may also be called balanced or
coupled transmission lines. The required TDR sources and
samplers are different for differential lines, as are the probes
used to make contact to the test structures, but this method
is directly applicable to differential waveforms.
6.1.3 Environmental Factors
Temperature and humidity
should be monitored during the test. Long exposures to tem-
perature and humidity other than standard laboratory condi-
tions (temperature range of 20 to 23 °C and relative humidity
range of 35 to 65%) can affect the dielectric properties of the
materials in the test objects, and thus the propagation delay.
Furthermore, the electrical characteristics of the TDR, such as
sampler gain, are temperature dependent. Therefore, for the
most repeatable measurements, the TDR instrumentation
should be maintained within the manufacturer recommended
temperature and humidity ranges. Low relative humidity may
result in electrostatic discharge damage to the TDR unit.
6.1.4 Measurement Accuracy and Repeatability
Accu-
racy and repeatability depend on the impedance of the line
being measured, the type and condition of probes, cables,
sampling head, and the experience of the test technician.
Accuracy is the difference between the most likely measure-
ment and the defined standard. The most likely measurement
is also called the mode of all measurements within a sample
set. Three times the standard deviation around each side of
the mode is the repeatability.
The ability to resolve a measurement value is fundamental to
the accuracy of any measurement process. The TDR instru-
ment should have sufficient measurement resolution to facili-
tate the accuracy requirements of the measurement method
described herein. The total risetime of the TDR system (includ-
ing cables, probes, etc.) and step aberrations define the
impedance resolution (see 4.1.2).
6.1.5 General Cautionary Statement
TDR test systems
and associated accessories are precision high frequency
devices. Most TDRs include hardware to protect the static-
sensitive sampling heads. However, operators and mainte-
nance staff should take proper ESD precautions (see manu-
facturer’s recommendations). High frequency cables, because
they typically use solid center conductors, are not as flexible
as typical coaxial cables. Consequently, care should be taken
not to excessively bend and flex the high frequency cables.
Number
2.5.5.11
Subject
Propagation Delay of Lines on Printed Boards by TDR
Date
04/2009
Revision
IPC-TM-650
Page
13
of
16