IPC-TM-650 EN 2022 试验方法--.pdf - 第401页
Users of this test m ethod should ap ply the pr inciples outlined in E-691 to g enerate the data specific to their laboratory and mat erial s, or bet ween spec if ic l abora tories . The pri nci ples would th en be valid…
The factors f, Φ and ψ are given in Table 7-1 and Table 7-2
for each geometry. This value of E/(1 - v
2
) be compared
with that obtained from K
1c
2 /G
1c
. The former value should
be the larger, but the difference should be <15 %. The cor-
rected compliance, C
c
, is obtained from the measured com-
pliance in the fracture test, C
Q
, and the compliance from the
indentation test, Ci, in accordance with the following:
C
c
= C
Q
- C
i
[Ref. 5, SENB]
Φ ψ η
0.450 8.34 0.208 28.9 2.64
0.455 8.45 0.207 29.6 2.63
0.460 8.57 0.207 30.4 2.61
0.465 8.70 0.206 31.1 2.60
0.470 8.83 0.205 31.9 2.58
0.475 8.96 0.204 32.7 2.57
0.480 9.09 0.203 33.5 2.56
0.485 9.23 0.202 34.4 2.54
0.490 9.36 0.201 35.3 2.53
0.495 9.51 0.200 35.3 2.53
0.500 9.65 0.199 37.1 2.51
0.505 9.81 0.198 38.0 2.50
0.510 9.96 0.197 39.0 2.49
0.515 10.12 0.196 40.0 2.48
0.520 10.28 0.194 41.1 2.47
0.525 10.45 0.193 42.1 2.46
0.530 10.62 0.192 43.3 2.45
0.535 10.80 0.190 44.4 2.44
0.540 10.98 0.189 45.6 2.43
0.545 11.17 0.188 46.8 2.42
0.550 11.36 0.186 48.1 2.41
Values calculated using J. A. Knapp, G. S. Leger and B. Gross, Fracture
Mechanics Sixteenth Symposium, ASTM, STP 868, 19, pp. 27 - 44.
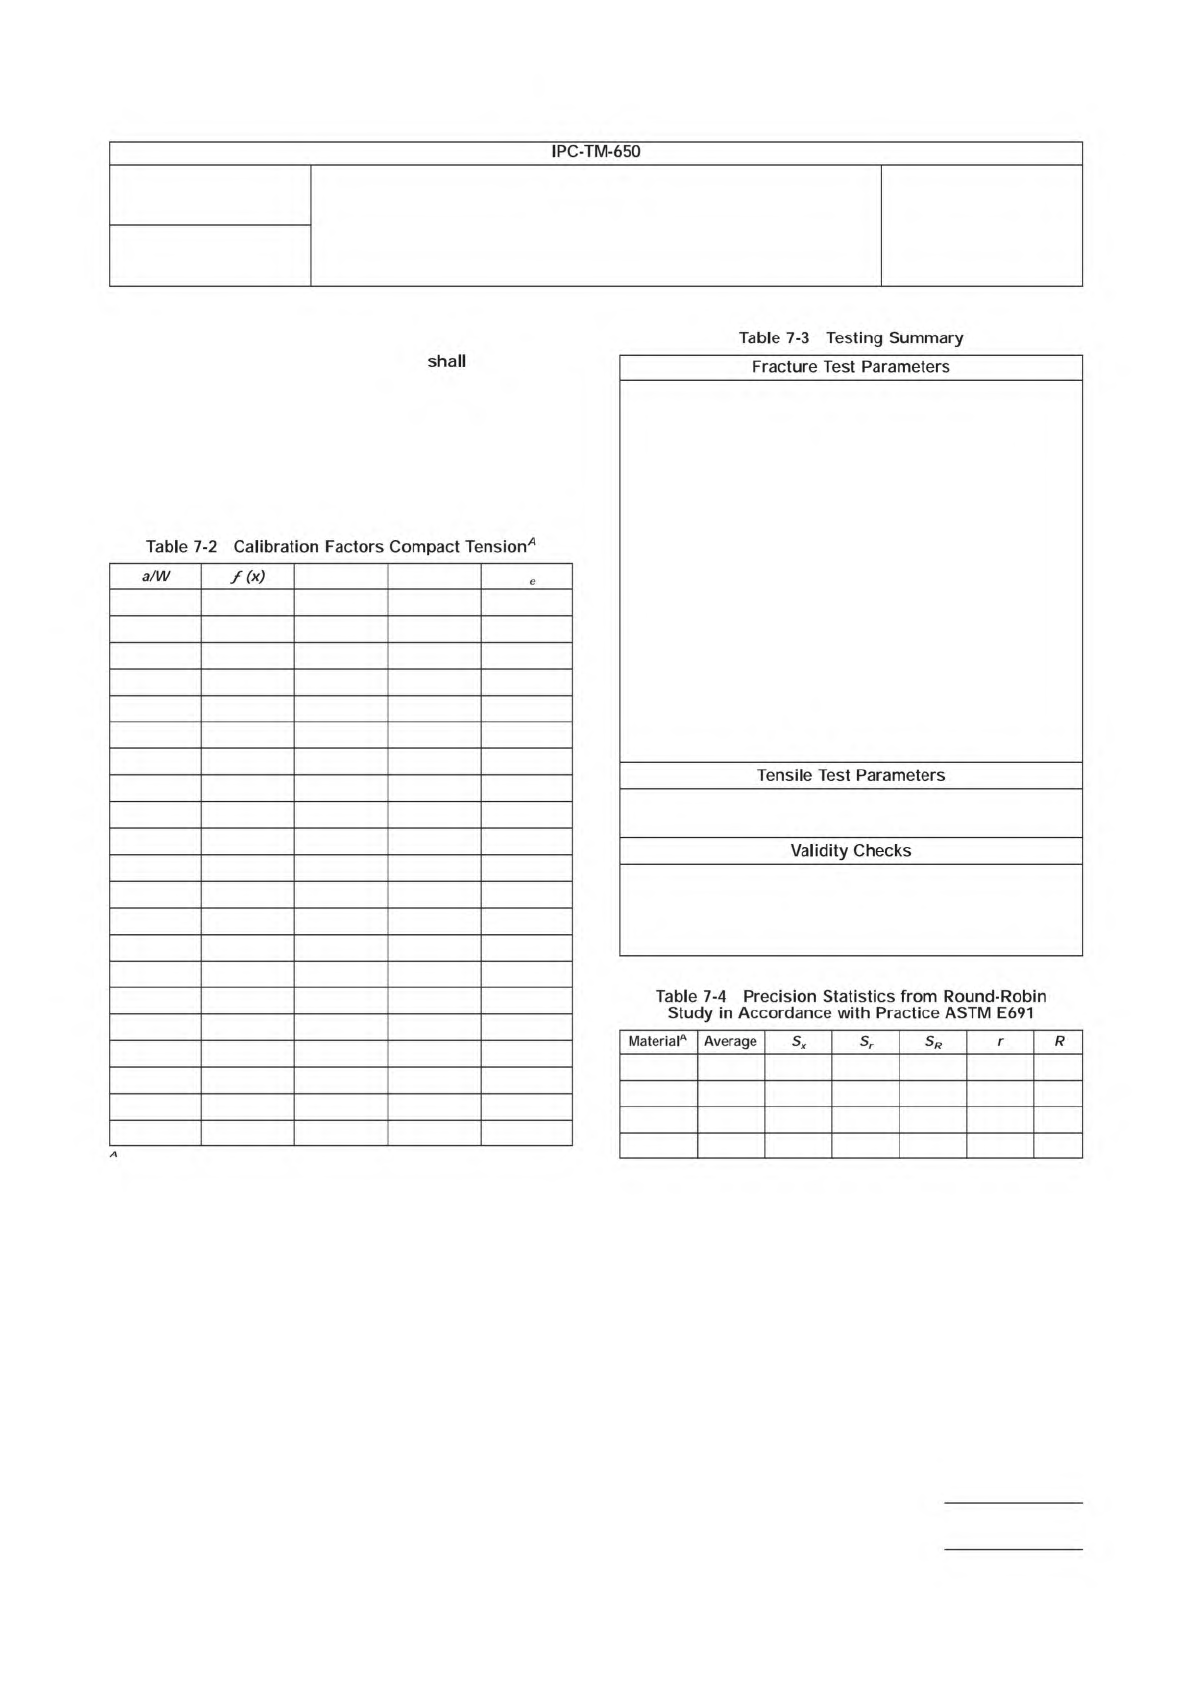
7.4 Report
List the information required to perform the test
and the results obtained in the form of a table. The form to
use is provided in Table 7-3.
7.4.1
Table 7-4 is based on a round robin conducted in
1988 in accordance with E-691, involving four materials
tested by nine laboratories. For each material, all the samples
were prepared at one source, but the individual specimens
were prepared at the laboratories which tested them. Each
test result was the average of three individual determinations.
Each laboratory obtained one test result for each material. The
following explanations of r and R are only intended to present
a meaningful way of considering the approximate precision of
this test method. The data in Table 7-4 should not be rigor-
ously applied to acceptance or rejection of material, as those
data are specific to the round robin and may not be represen-
tative of other lots, conditions, materials, or laboratories.
Testing Laboratory
Materials/orientation
Specimen geometry
Test temperature, °C
Loading rate, m/s
Notching method
Specimen number
Width (W), mm
Crack length from 7.2.2, mm
P
max
, N
P
max
loading rate, s
PQ loading time, s
Stable or unstable growth
K
Q
, MPa - m
1/2
Uncorrected energy, J
Corrected energy, J
G
Ic
, kJ/m
2
σy, MPa
σy loading time, s
Pmax/PQ
2.5 (KQ/sy)
2
E/(1 - ν
2
) via C, MPa
E/(1 - ν
2
) via K
Q
2
/G
c
, MPa
A 4.34 0.652 0.235 0.679 0.658 1.90
B 5.70 1.420 0.618 1.510 1.730 4.23
C 3.60 0.692 0.343 0.747 0.960 2.09
D 5.90 1.950 0.944 2.100 2.640 7.39
A
Material A is values of K
Ic
for nylon. Material B is values of G
Ic
for nylon.
Material C is values of K
Ic
for polycarbonate. Material D is values of G
Ic
for
polycarbonate. Units for all columns are as follows: K
Ic
[=] MP
a
Ë m
1/2
& G
Ic
[=] kJ/m
2
.
Number
2.4.52
Subject
Fracture Toughness of Resin Systems for Base Materials
Date
07/13
Revision
Page 7 of 8
IPC-TM-650
shall
Table
7-2
Calibration
Factors
Compact
Tension*
a/W
/(x)
e
Table
7-3
Testing
Summary
Fracture
Test
Parameters
Tensile
Test
Parameters
Validity
Checks
Table
7-4
Precision
Statistics
from
Round-Robin
Study
in
Accordance
with
Practice
ASTM
E691
Material
Average
Sx
s
「
r
R

Users of this test method should apply the principles outlined
in E-691 to generate the data specific to their laboratory and
materials, or between specific laboratories. The principles
would then be valid for such data.
7.4.2
Concept of r and R (Reference ASTM D5045, Section
11.2). If Sr and SR have been calculated from a large enough
body of data, and for test results that were averages from
testing three specimens, the following information applies.
7.4.2.1
Repeatability, r (comparing two test results for the
same material, obtained by the same operator using the same
equipment on the same day). The two test results should be
judged not equivalent if they differ by more than the r value for
that material.
7.4.2.2
Reproducibility, R (comparing two test results for the
same material, obtained by different operators using different
equipment on the same day). The two test results should be
judged not equivalent if they differ by more than the R value
for that material.
7.4.2.3
Any judgement in accordance with the above would
have an approximate 95 % (0.95) probability of being correct.
7.4.3 Bias
There are no recognized standards by which to
estimate bias of these test methods.
7.4.4 Keywords (Reference ASTM D 5045, Section 12)
• Critical-strain energy release rate
• Energy-to-break
• Fracture toughness
• Plane-strain fracture toughness
References
(1) Brown, W. F., Jr., and Srawley, J. E., “Plane Strain Crack
Toughness Testing of High Strength Metallic Materials,” ASTM
STP 410, ASTM, 1966, p.1.
(2) “Fracture Toughness Testing and Its Applications,” ASTM
STP 381, ASTM, April 1965, p.30.
(3) Srawley, J. E., “Wide Range Stress Intensity Factor
Expressions for ASTM E399 Standard Fracture Toughness
Specimens,” International Journal of Fracture Mechanics, Vol.
12, June 1976, p.475.
(4) Newman, J. C., “Stress Analysis of Compact Specimens
Including the Effects of Pin Loading,” ASTM STP 560, ASTM,
1974, p.105.
(5) Williams, J. G., “Fracture Mechanics of Polymers,” Ellis
Horwood/Wiley, 1985.
(6) Towers, O. L., “Stress Intensity Factors, Compliances and
Elastic η
e
Factors for Six Test Geometries,” The Welding Insti-
tute, March 1981.
Number
2.4.52
Subject
Fracture Toughness of Resin Systems for Base Materials
Date
07/13
Revision
Page 8 of 8
IPC-TM-650
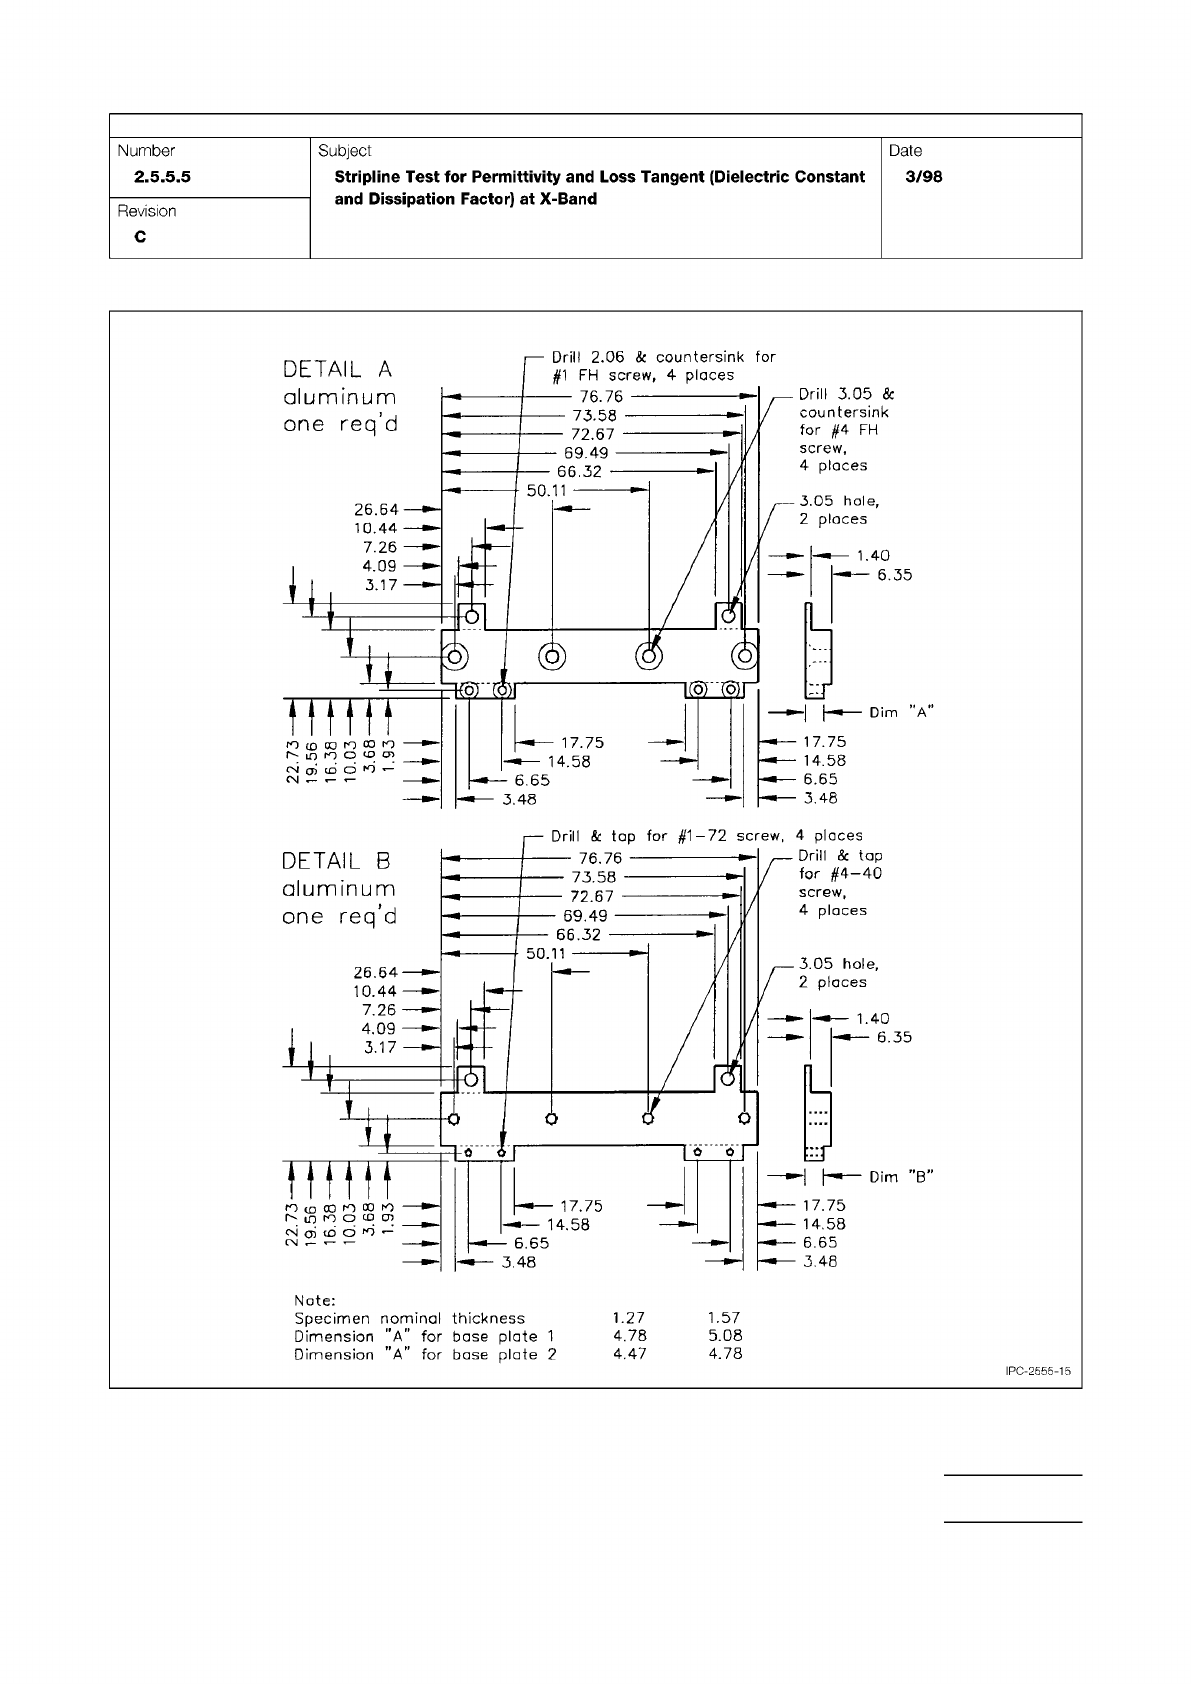
Figure 15 Test Fixture Construction, Older Design
IPC-TM-650
Page 23 of 25
r
50.11
Q
]
0
0
r
Dim
”B”
—
76.76
-
73.58
-
72.67
69.49
-
66.32
-
17.75
14.58
6.65
3.48
3.05
hole,
2
places
Drill
&
tap
for
#4-40
screw,
4
places
Drill
&
tap
for
#1-72
screw,
4
places
17.75
v—
14.58
!■*—
6.65
-
•-
548
—
—
1.40
v
—
6.35
DETAIL
B
aluminum
one
req'd
26.64—
10.44
—
7.26
——
—
4.09
—
3.17
—
Nate:
Specimen
nominal
thickness
1.27
1.57
Dimension
"A"
for
base
plate
1
4.78
5.08
Dimension
"A"
for
base
plate
2
4.47
4.78
©
©
©
K3F
mrn
A
17.75
14.58
17.75
14.58
6.65
3.48
3.05
hole,
2
places
DETAIL
A
aluminum
one
req'd
Drill
3.05
&
countersink
for
#4
FH
screw,
4
places
Drill
2.06
&
countersink
for
#1
FH
screw,
4
places
—
76.76
一
73.58
-
72.67
-
69.49
-
66.32
—
50.11
26.64
10.44
7.26
——
4.09
—
3.17
6.65
3.48
二
及
l)
=K5F
册
1.40
6.35
PC-2555-15
Number
2.5.5.5
Subject
Stripline
Test
for
Permittivity
and
Loss
Tangent
(Dielectric
Constant
and
Dissipation
Factor)
at
X-Band
Date
3/98
Revision
C
r-TTHn
29.0
n
OL
996L
R7Z