2OM-1104-001.pdf - 第82页
*3 Maint. Stop T otal Count This indicates the number of times the machine was stopped for maintenance operations (described below in *4 through *7). The indicated value is the total of *4 through *7. *4 Hand Cleaning St…
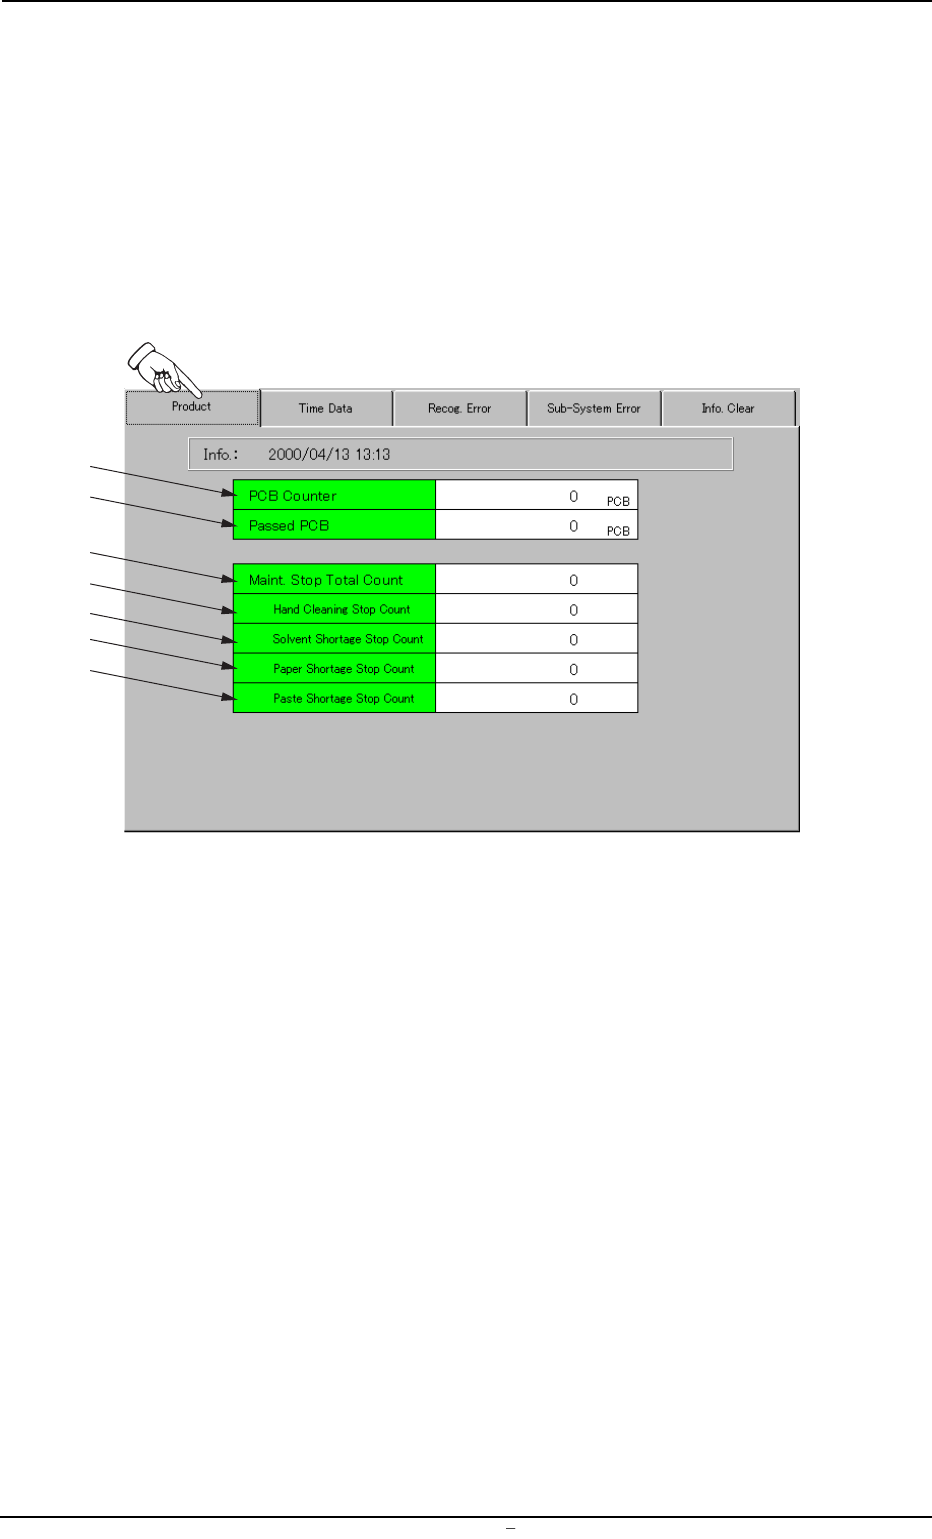
2.1 "Product" Tab
Displayed is the data that represents the actual production rate of the
machine.
• Sheet Layout
When the "Product" tab is pressed in the "MANAGE. DATA 1" window
(submenu), the following tab sheet appears.
Fig. 3C4 "Product" Tab Sheet
• Sheet Composition
*1 PCB Counter
This indicates the number of produced P.C.B.’s in "PRINT" mode
(operation mode).
The system counts the number of times the table was zeroed after
the end of each printing and the result is regarded as the number
of produced P.C.B.’s.
*2 Passed PCB
This indicates the number of P.C.B.’s that have been transferred
without being printed in the "PASS" mode (operation mode).
The system counts the number of times the P.C.B.’s were trans-
ferred from the table to the R conveyor and the result is regarded
as the number of passed P.C.B.’s.
0004-001 Chapter 1 3 6 AFU01EDTP
2.1
"
Product
"
Tab
*1
*2
*3
*4
*5
*6
*7
*3 Maint. Stop Total Count
This indicates the number of times the machine was stopped for
maintenance operations (described below in *4 through *7).
The indicated value is the total of *4 through *7.
*4 Hand Cleaning Stop Count
This indicates the number of times the machine was stopped for
manual cleaning operations.
*5 Solvent Shortage Stop Count
This indicates the total number of times the machine was stopped
because it was detected that only a little amount of cleaning sol-
vent remained.
*6 Paper Shortage Stop Count
This indicates the total number of times the machine was stopped
because it was detected that the machine became empty of clean-
ing paper.
*7 Paste Shortage Stop Count
This indicates the total number of times the machine was stopped
because the number of P.C.B.’s (Paste Empty Stop (PCB)) reached
the specified value.
When the paste remainder detection sensor (option) is
used, it detects that paste is consumed up and the num-
ber of times by which the machine has stopped is also
added.
0106-003 Chapter 1 3 7 AFU01EDTP
2.1
"
Product
"
Tab
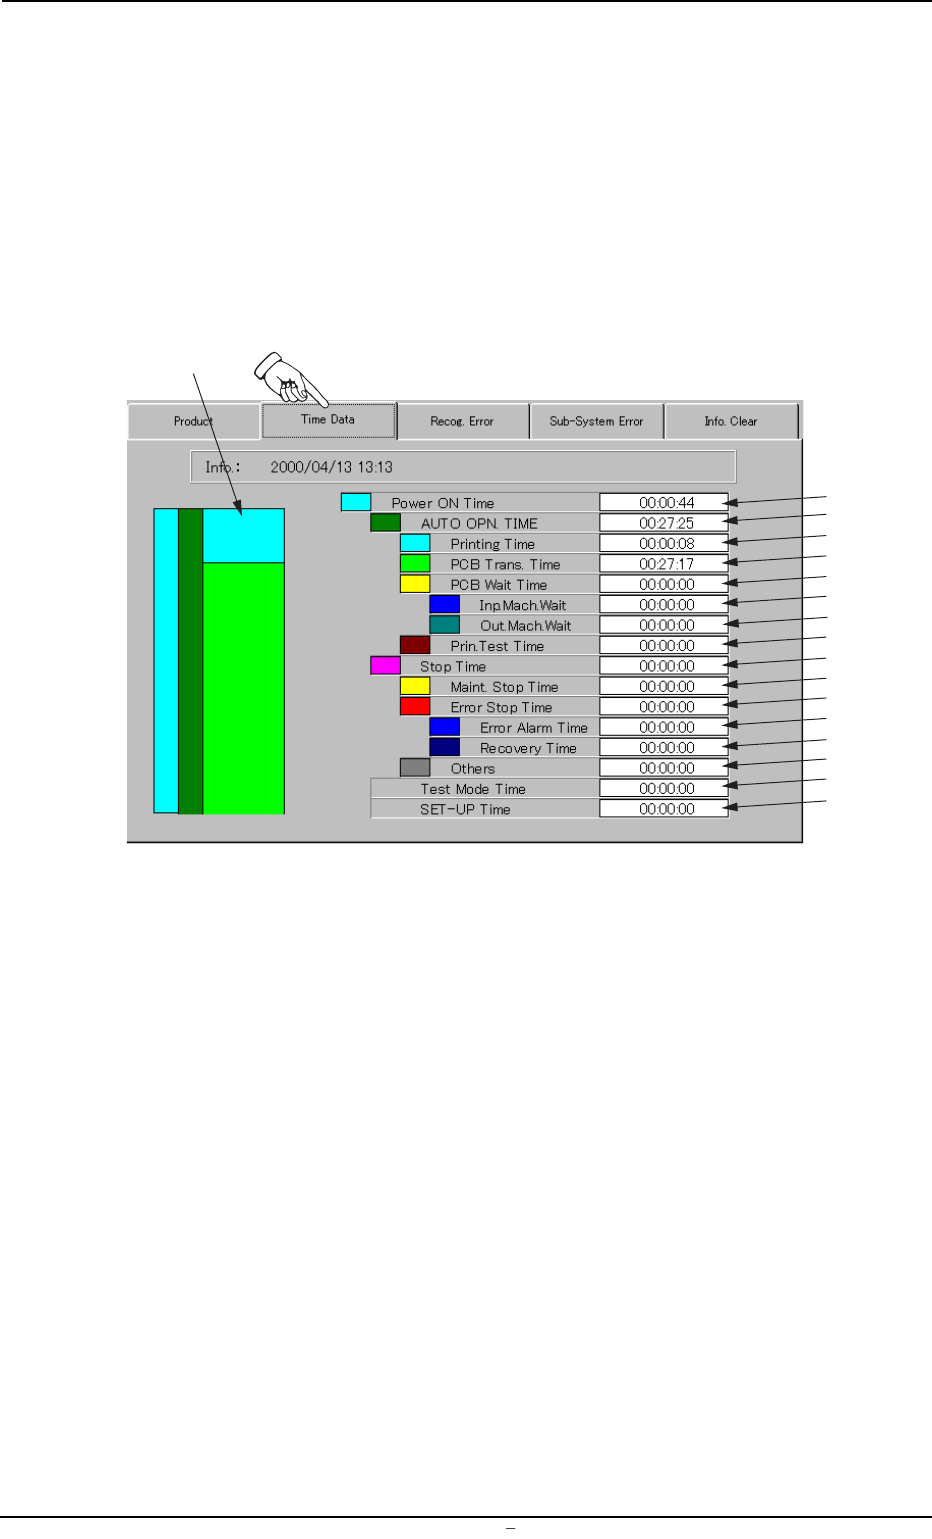
2.2 "Time Data" Tab
Displayed is the data that represents the cumulative periods of running
time for each operation mode.
• Sheet Layout
When the "Time Data" tab is pressed in the "MANAGE. DATA 1" win-
dow (submenu), the following tab sheet appears.
Fgi. 3C5 "Time Data" Tab Sheet
• Sheet Composition
*1 Ratio Chart of Operation Time
Each time ratio based on "Power ON Time" (described below in *2)
is classified by colors and charted by columns. The colors in the
chart correspond to those indicated before each name.
Each time ratio is updated every 5 seconds.
*2 Power ON Time
This indicates the cumulative period of time ("*3 AUTO OPN. TIME"
+ "*10 Stop Time") during which the control power was ON.
*3 AUTO OPN. TIME
This indicates the cumulative period of time ("*4 Printing Time" +
"*5 PCB Trans. Time" + "*6 PCB Wait Time" + "*9 Print. Test Time")
during which the object P.C.B.’s were produced.
0004-001 Chapter 1 3 8 AFU01EDTP
2.2
"
Time Data
"
Tab
*1
*2
*3
*4
*5
*6
*7
*8
*9
*10
*11
*12
*13
*14
*15
*16
*17