00191413-01.pdf - 第503页
User Manual Line Computer UNIX 16 MaDaMaS Software Version 501.xx 01/99 Issue 16.2 MaDaMaS Evaluation User Interface 16 - 7 16.2 MaDaMaS Evaluation User Interface The logged product ion dat a can b e called up from the M…
User Manual Line Computer UNIX 16 MaDaMaS
Software Version 501.xx 01/99 Issue 16.1 Introduction
16 - 6
Group 4
Cycle mode active
Start: Actuation of Stop button and selection of "Cycle mode on" from the menu.
Ende: Actuation of the Start button and "Cycle mode off" from the menu.
Keyswitch in slow position
Start: Turning keyswitch to the "slow" position (minimum speed).
Ende: Turning the keyswitch back to normal speed, actuation of the Start button.
Single Function / Vision System
Start: Selection of "Single functions" or "Vision system" from the menu.
Ende: Exiting from the "Single functions" or "Vision system" menu.
User Manual Line Computer UNIX 16 MaDaMaS
Software Version 501.xx 01/99 Issue 16.2 MaDaMaS Evaluation User Interface
16 - 7
16.2 MaDaMaS Evaluation User Interface
The logged production data can be called up from the MaDaMaS evaluation user interface.
The evaluation user interface is opened by clicking on the MaDaMaS icon on the desktop. From this user
interface a series of evaluation types can be called up by means of which the production data for a line or
individual stations can be evaluated. The display of the production data always refers to the currently set time
basis (see section 16.2.5.1).
The following global evaluations of all stations of the line are available. They are called up from the
EVALUATIONS menu (see section 16.2.3):
- Overall view: Status of the entire line, represented by means of the evaluation types
"Pick-up reliability", "Availability" and "Performance"
- Pick-up reliability: Pick-up reliability of all stations, displayed for every individual station
of a line.
- Availability: Availability of the stations, displayed for every individual station
of a line.
- Performance: Placement performance rate of all stations, displayed for every individual
station of a line.
The following evaluations are only available for the individual stations. They are called up by clicking on the
bars and symbols in the view area in each case:
- Track trend: Display ranking the eight tracks of a station with the highest error rates
(tracks with the highest rate of identity and vaccum errors).
- Track information: Display of all tracks of a station including a listing of all identity and
vacuum errors that occurred.
- System diagram: Current status display of the line or a station.
- Distribution of events: Distribution of the events on a station.
- List of events: Listing of all events that occurred for each PCB.
When MaDaMaS is opened, the "Overall view" of the entire line is displayed as the initial evaluation screen.
Another type of evaluation can be set at any time.
User Manual Line Computer UNIX 16 MaDaMaS
Software Version 501.xx 01/99 Issue 16.2 MaDaMaS Evaluation User Interface
16 - 8
16.2.1 Starting MaDaMaS
● Click on the MaDaMaS icon on the desktop.
The evaluation user interface is opened by displaying the (initial) evaluation screen "Overall view"
for the current line (see Fig. 16.2.1).
NOTE
If the area containing the bar chart icon is clicked on in a station display in the view area of the desk-
top (see chapt. 3, Fig. 3.1.2), the MaDaMaS evaluation screen will open as well.
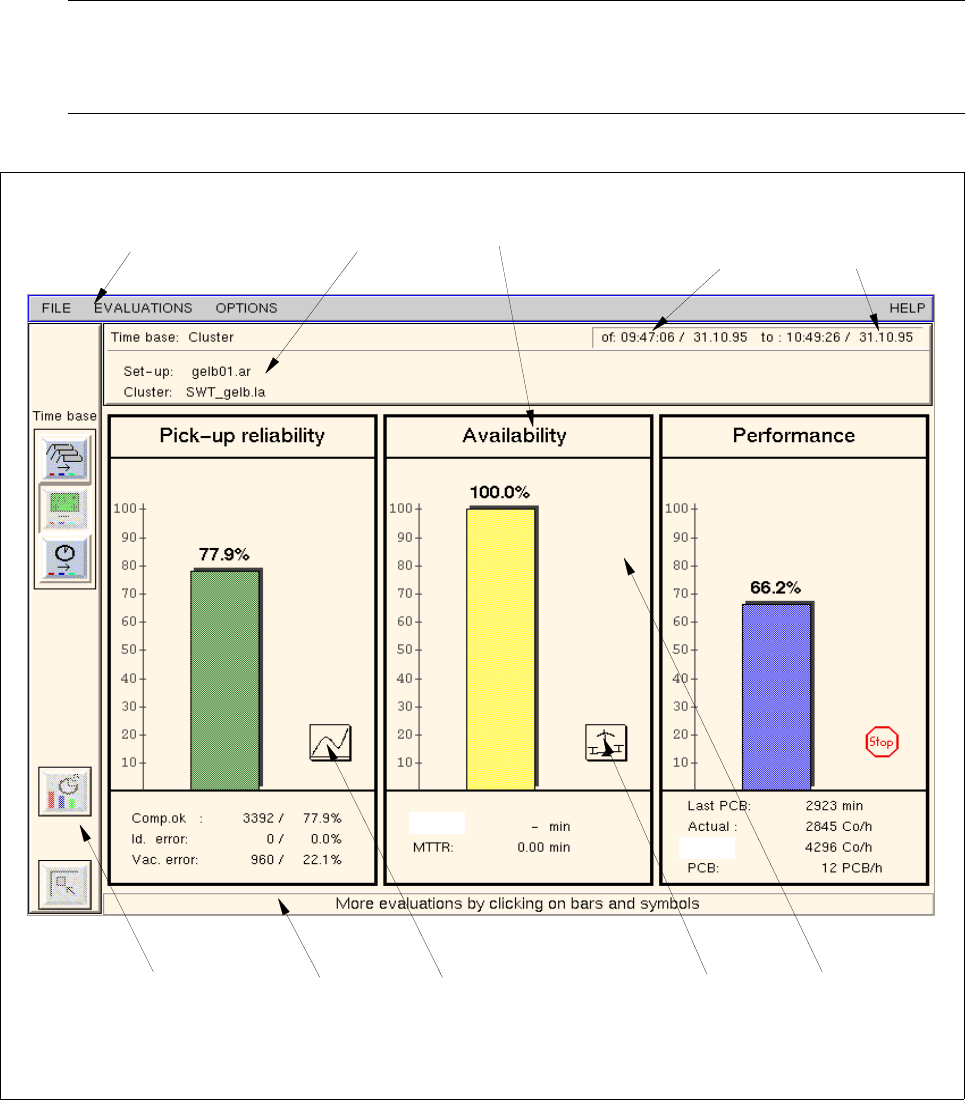
Fig. 16.2.1 Evaluation user interface - "Overall view" evaluation
menu bar
info area evaluation type
command area info line
view area
starting time
of the evaluation
end of the
evaluation
call-up of the
call-up of the
"System diagram"
evaluation
evaluation
"Track trend"
theor.:
MTBI: