00191413-01.pdf - 第515页
User Manual Line Computer UNIX 16 MaDaMaS Software Version 501.xx 01/99 Issue 16.2 MaDaMaS Evaluation User Interface 16 - 19 NOTE If more s tations e xist tha n can be d isplaye d in the v iew area , a scroll bar appe ar…
16 MaDaMaS User Manual Line Computer UNIX
16.2 MaDaMaS Evaluation User Interface Software Version 501.xx 01/99 Issue
16 - 18
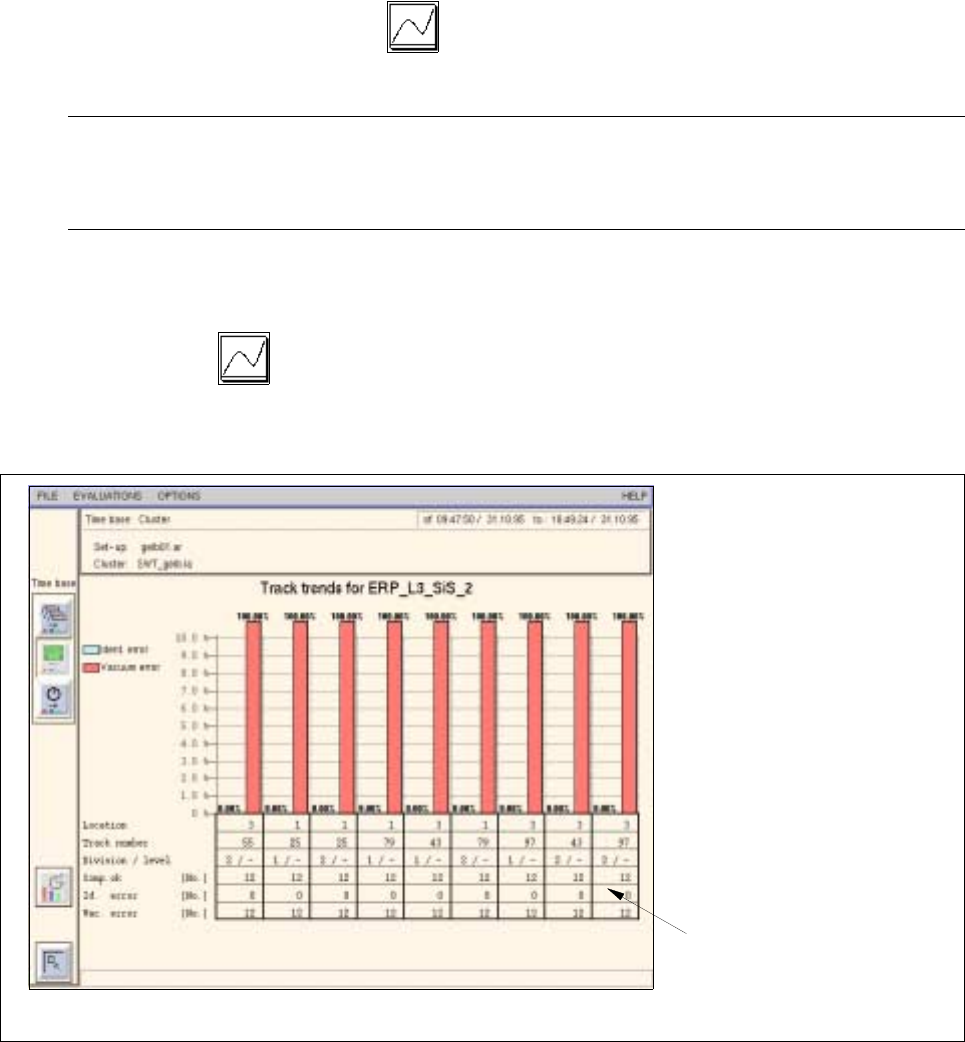
16.2.7.1 "Track Trend" Evaluation
The "Track trend" type of evaluation allows the eight tracks with the highest identity and vacuum error rates to
be displayed for each station. In the view area the encountered vacuum and identity errors are displayed in
absolute values (text portion) as well as relative (bar chart) to the total number of components placed.
The "Track trend" evaluation is called up from the "Pick-up reliability" chart. This is only possible for placement
stations.
- Calling up the "Track trend" evaluation for all stations
● In the Overall View click on the icon in the "Pick-up reliability" chart.
The track trend evaluation is displayed for all stations.
NOTE
By scrolling the view area using the vertical scroll bar the track trend evaluation can be displayed for
every individual station.
- Calling up the "Track trend" for the individual stations
● Click on the icon in the "Pick-up reliability" evaluation of the diagram of the desired station
(see Fig. 16.2.2).
The track trend evaluation for the selected station is opened (see Fig. 16.2.3).
Fig. 16.2.3 Evaluation user interface - "Track trend" evaluation for a station
number of
components placed,
identity and vacuum errors
User Manual Line Computer UNIX 16 MaDaMaS
Software Version 501.xx 01/99 Issue 16.2 MaDaMaS Evaluation User Interface
16 - 19
NOTE
If more stations exist than can be displayed in the view area, a scroll bar appears above the info line per-
mitting the display area to be scrolled.
- Exiting from the "Track trend" evaluation
● Click on the icon.
The "Pick-up reliability" or "Overall view" evaluation is redisplayed.
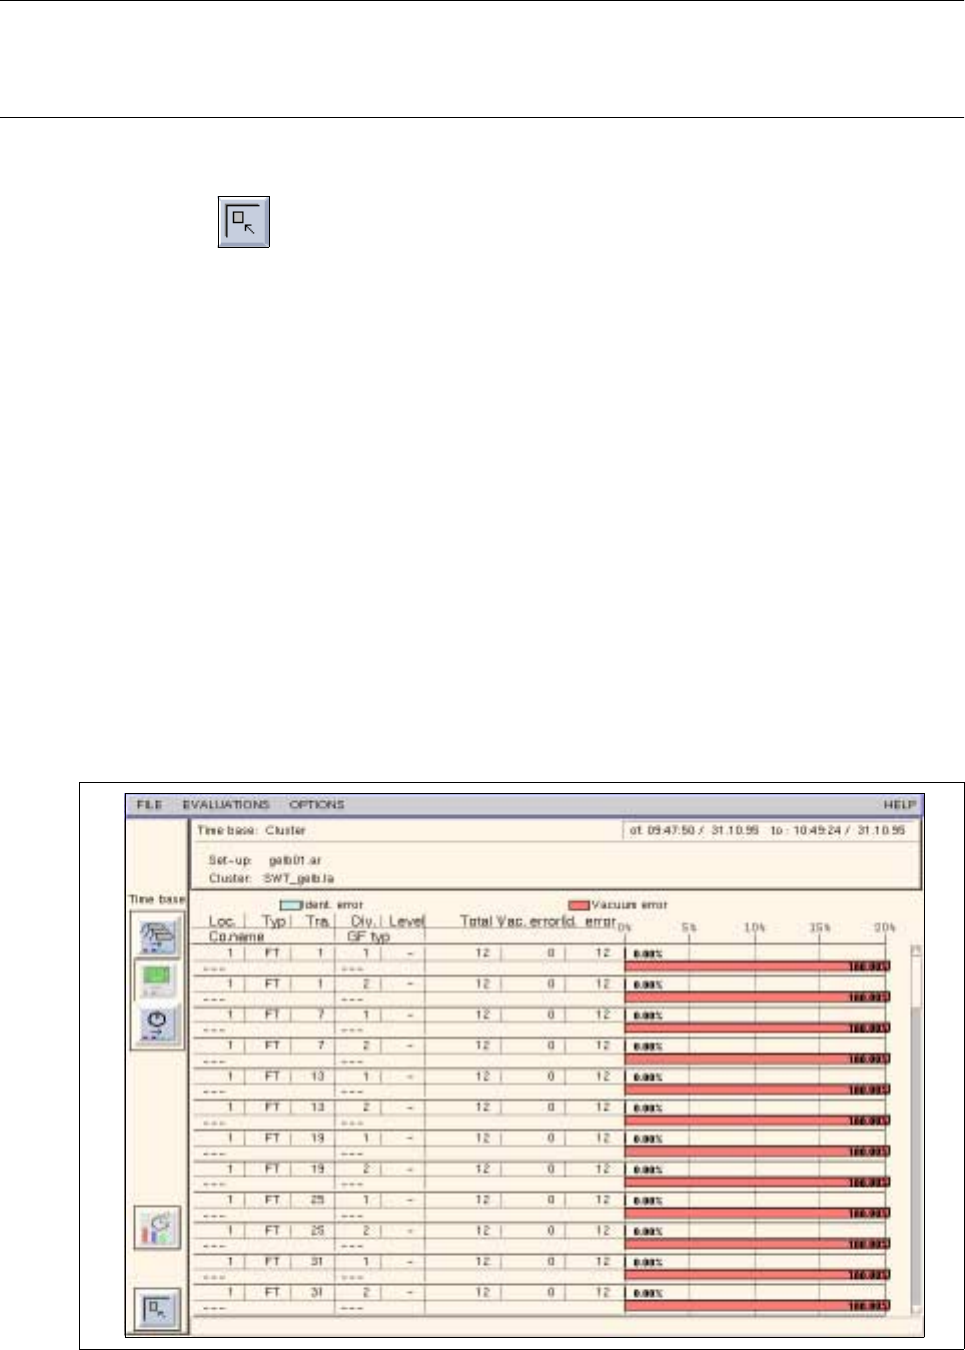
16.2.7.2 "Track information" Evaluation
The "Track information" evaluation provides detailed information about the malfunctions that occurred as a
result of vacuum and identity errors on the individual tracks. The precise allocation of the tracks as well as the
vacuum and identity errors encountered are displayed in absolute values (table) as well as relative (bar chart)
to the total number of components placed.
The "Track information" evaluation is called up from the "Pick-up reliability" chart. It is only available for
placement stations.
- Calling up the "Track information" evaluation for a station
● Click on the green bar in the "Pick-up reliability" chart of the desired station (see Fig. 16.2.2).
The track information evaluation for the selected station is displayed (see Fig. 16.2.4).
Fig. 16.2.4 Evaluation user interface -
"
Track information" evaluation for a station
16 MaDaMaS User Manual Line Computer UNIX
16.2 MaDaMaS Evaluation User Interface Software Version 501.xx 01/99 Issue
16 - 20
The track errors of the station are displayed as numerical values in the left portion of the view area, and in the
form of bar charts in the right portion. The numerical values contained in the columns "Total comp.", "Vacuum
error" and "Ident. error" are absolute values. They reflect the number of "good" placements as well as the
number of vacuum and identity errors that occurred during the selected evaluation period.
In the graphical display of the track errors in %, the individual bar lengths correspond to the percentage of the
respective error class (vacuum or identity error) in relation to the overall placement attempts on this track. A
bar is displayed for every error class (vacuum and identity errors).
- Exiting from the "Track information" evaluation
● Click on the icon.
The "Pick-up reliability" evaluation is redisplayed.
16.2.8 "Availability" Evaluation
16.2.8.1 "Availability - Linie" Type of Evaluation
The availability of a line is a value permitting an assessment of the "technical quality" of the line and the
placement/glueing process carried out thereon. Organizational or structure-related downtimes must not have
any impact on the availability. The special case of a PCB "passing through" without any assembly operation
taking place is, however, included in the evaluation.
The availability of a line is calculated as follows:
T
at
= machine-related technical downtimes, e.g. unidentified reason, fiducial error, general machine
malfunction, transport error, barcode reading error (see also page 16 - 3)
T
b
= total operating time of the machine, or time basis for the evaluation period
n = number of the stations
If the limit value set under "Availability" is exceeded, the icon is highlighted in red.
- Calling up the "Availability" evaluation for the line
● On the menu bar select EVALUATIONS --> Overall view.
The "Overall view" evaluation is displayed.
In the "Availability" chart, the availablity calculated for the entire line is displayed (see Fig. 16.2.1).
Availability
line
[ % ] = 100 x ( 1 - (Σ T
at
/ Σ T
b
))
i i
n n
n=1 i=1