00191413-01.pdf - 第528页
16 MaDaMaS User Manu al Line Computer UNIX 16.2 MaDaMaS Evaluation User Interface Software Version 501.xx 01/99 Issue 16 - 32 - Calling up the "Per formance" e valuation for the line ● On the menu ba r se lect …
User Manual Line Computer UNIX 16 MaDaMaS
Software Version 501.xx 01/99 Issue 16.2 MaDaMaS Evaluation User Interface
16 - 31
No. of PCBsl [pcs.] Number of PCBs that have passed through the station since the start time
indicated in the info area (see Fig. 16.2.8)
Total comp. [pcs.] Number of components that have been placed by the station since the start time
Ident. error [no.] / [%] Number of identity errors that have occurred on the station since the start time
Vacuum error [no.] / [%]Number of vacuum errors that have occurred on the station since the start time
Set-up Name of the current set-up on the station
Cluster Name of the PCB type currently processed on the station
- Exiting from the "System Diagram" evaluation
● Click on the icon.
The "Availability" or "Overall view" evaluation is redisplayed.
16.2.9 "Performance" Evaluation
An essential criterion for the operation of the SIPLACE machines is the calculation of the placement rate. Apart
from the absolute number of components placed, also the ratio of the actual performance to the theoretically
achievable performance is of significance.
This relative performance is calculated as follows:
The number of minutes elapsed since the completion of the last PCB is displayed below the "Performance"
chart (see also section 16.2.9.1). In addition, the theoretical performance and the actual performance of the
machine are indicated as well as the number of PCBs per hour.
The "Performance" evaluation is available for the entire line as well as for all placement stations.
measured line performance
Rel. performance [%] = 100 x
theoretical performance
16 MaDaMaS User Manual Line Computer UNIX
16.2 MaDaMaS Evaluation User Interface Software Version 501.xx 01/99 Issue
16 - 32
- Calling up the "Performance" evaluation for the line
● On the menu bar select EVALUATIONS --> Overall view.
The "Overall view" evaluation including the "Performance" chart is displayed
(see Fig. 16.2.1).
- Calling up the "Performance" evaluation for all placement stations
● On the menu bar select EVALUATIONS --> Performance.
Or else:
● Click on the blue bar in the "Performance" chart of the overall view.
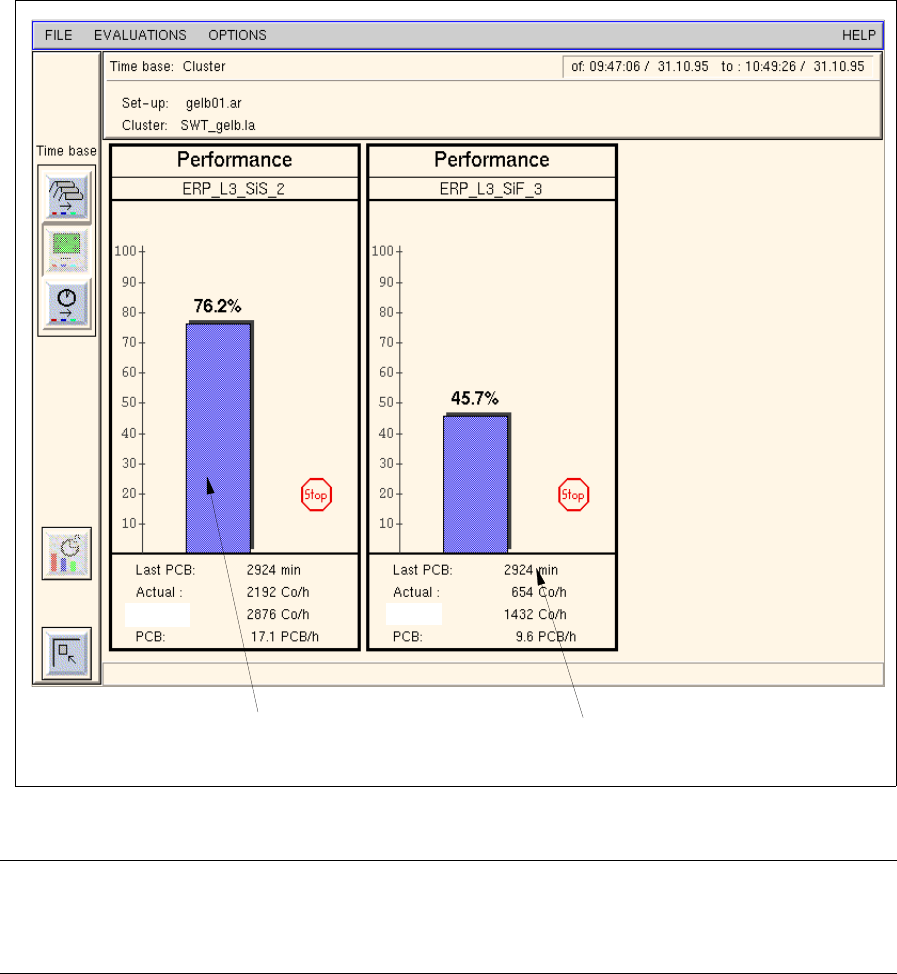
● The "Performance" chart is displayed for all placement stations (see Fig. 16.2.9)
Fig. 16.2.9 Evaluation user interface - "Performance" evaluation for all stations
NOTE
If more stations exist than can be displayed in the view area, a scroll bar appears above the info line
permitting the display area to be scrolled.
indication of the time period since the
completion/abortion of the last PCB
bar indicating the relative
performance of the station
theor.:
theor.:

User Manual Line Computer UNIX 16 MaDaMaS
Software Version 501.xx 01/99 Issue 16.2 MaDaMaS Evaluation User Interface
16 - 33
16.2.9.1 "Last PCB" Evaluation
The "Last PCB" evaluation displays for the entire line and for each station of the line the minutes that have
elapsed since the time of completion (or abortion) of the last PCB.
If this time span, starting with the completion/abortion of the last PCB, exceeds the "Timeout" value preset under
Limit Values, the icon is displayed in the "Performance" chart (see section 16.2.4.1). The station has
come to a standstill.
The "Last PCB" evaluation is of importance owing to the fact that the data will not be updated until a new PCB
has been completed. It is available for the entire line and for all placement stations.
- Calling up the "Last PCB" evaluation for the line
● On the menu bar select EVALUATIONS --> Overall view.
The "Overall view" evaluation is displayed.
The "Last PCB" evaluation for the entire line is displayed in the field below the "Performance"
chart (see Fig. 16.2.1).
- Calling up the "Last PCB" evaluation for all stations
● On the menu bar select EVALUATIONS --> Performance.
Or else:
● Click on the blue bar in the "Performance" chart in the overall view.
The "Performance" chart is displayed for all placement stations.
The time that has elapsed since the completion/abortion of the last PCB is displayed for each
station in the field below the "Performance" chart (see Fig. 16.2.9).