00191413-01.pdf - 第526页
16 MaDaMaS User Manu al Line Computer UNIX 16.2 MaDaMaS Evaluation User Interface Software Version 501.xx 01/99 Issue 16 - 30 Explanation of the Sy stem Diagram: Bar chart: For each operation al st atus of a s tation (R …
User Manual Line Computer UNIX 16 MaDaMaS
Software Version 501.xx 01/99 Issue 16.2 MaDaMaS Evaluation User Interface
16 - 29
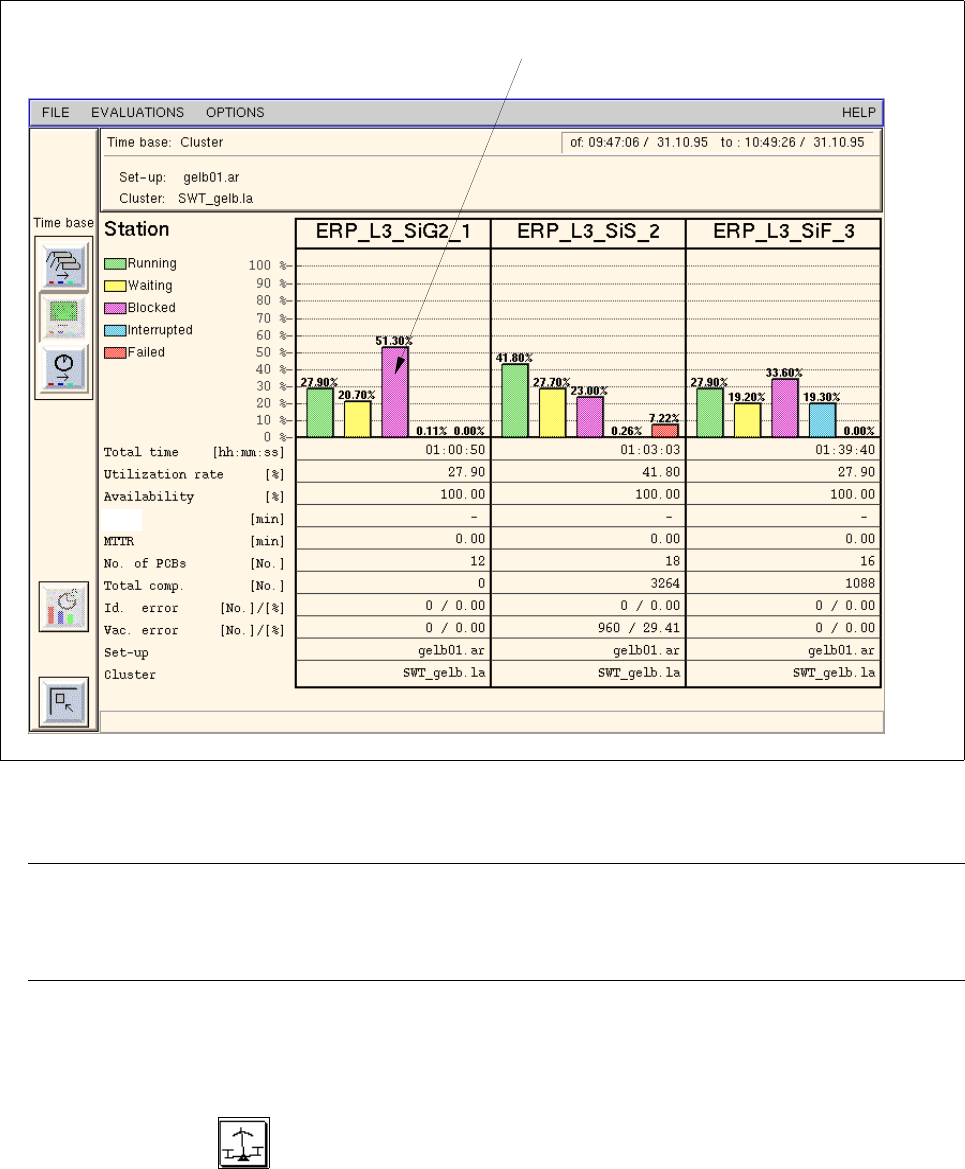
Fig. 16.2.8 Evaluation user interface - "System Diagram" evaluation for all stations
NOTE
If more stations exist than can be displayed in the view area, a scroll bar appears above the info line
per- mitting the display area to be scrolled.
- Calling up the "System Diagram" evaluation for a station
● Click on the icon in the "Availability" of the desired station (see Fig. 16.2.5).
The System Diagram for the selected station is displayed.
status of the station (e.g. "Blocked")
MTBI
16 MaDaMaS User Manual Line Computer UNIX
16.2 MaDaMaS Evaluation User Interface Software Version 501.xx 01/99 Issue
16 - 30
Explanation of the System Diagram:
Bar chart: For each operational status of a station (Running, Waiting, Blocked, Interrupted,
Failed) a colored bar is displayed indicating the proportion of time allocated to a
particular station in relation to the total processing time of all PCBs during the evaluation
period. The percentage value corresponding to the respective proportion of time is
indicated above every bar displayed.
Status:
Running --> The station is carrying out placement operations and performing position and
(green bar) inkspot recognition.
Waiting --> The station is waiting for a PCB from the preceding station, for the PCB
(yellow bar) in the center conveyor, for the output conveyor to be cleared, or for data.
Blocked --> The station is waiting for the subsequent station to take over the PCB from
(purple bar) the output conveyor so that the currently completed PCB can be conveyed
out of the center conveyor.
Interrupted --> The assembly of the PCB on the station was interrupted owing to the
(blue bar) following events, e.g.:
Abort button actuated, Emergency stop actuated (compressed air failure,
control deactivated), Stop button actuated, Cycle mode active, Single function/
Vision menu, Keyswitch in slow position, etc.
Failed --> The station is out of order with no outside intervention having taken place, e.g.
(red bar) after the third unsuccessful attempt at picking up a component.
Total time [hr:min:sec] This column shows the overall time in hours/minutes/seconds the particular
station has spent in the individual states during the evaluation period.
Utilization rate [%] This column contains the time percentage in relation to the total assembly
time the particular station has spent in the "Running" status during the evalua-
tion period.
The indicated value corresponds to the utilization rate achieved.
Availability [%] Availability of the line/station (see section 16.2.8)
MTBI [min] "Mean Time Beetween Interrupts" (see section 16.2.8.3)
MTTR [min] "Mean Time To Repair" see (section 16.2.8.4)
User Manual Line Computer UNIX 16 MaDaMaS
Software Version 501.xx 01/99 Issue 16.2 MaDaMaS Evaluation User Interface
16 - 31
No. of PCBsl [pcs.] Number of PCBs that have passed through the station since the start time
indicated in the info area (see Fig. 16.2.8)
Total comp. [pcs.] Number of components that have been placed by the station since the start time
Ident. error [no.] / [%] Number of identity errors that have occurred on the station since the start time
Vacuum error [no.] / [%]Number of vacuum errors that have occurred on the station since the start time
Set-up Name of the current set-up on the station
Cluster Name of the PCB type currently processed on the station
- Exiting from the "System Diagram" evaluation
● Click on the icon.
The "Availability" or "Overall view" evaluation is redisplayed.
16.2.9 "Performance" Evaluation
An essential criterion for the operation of the SIPLACE machines is the calculation of the placement rate. Apart
from the absolute number of components placed, also the ratio of the actual performance to the theoretically
achievable performance is of significance.
This relative performance is calculated as follows:
The number of minutes elapsed since the completion of the last PCB is displayed below the "Performance"
chart (see also section 16.2.9.1). In addition, the theoretical performance and the actual performance of the
machine are indicated as well as the number of PCBs per hour.
The "Performance" evaluation is available for the entire line as well as for all placement stations.
measured line performance
Rel. performance [%] = 100 x
theoretical performance