00191413-01.pdf - 第523页
User Manual Line Computer UNIX 16 MaDaMaS Software Version 501.xx 01/99 Issue 16.2 MaDaMaS Evaluation User Interface 16 - 27 16.2.8.6 "List of ev ents" Evaluation The "Lis t of events " evalu ation co…
16 MaDaMaS User Manual Line Computer UNIX
16.2 MaDaMaS Evaluation User Interface Software Version 501.xx 01/99 Issue
16 - 26
Explanation of the "Distribution of events" chart:
One line is displayed for each type of event that occurred during the evaluation period. Each line is subdivided
into three columns and a bar graph.
Column 1: Event
Name of the event
Column 2: Duration [hh:min:sec]
Total amount (Σ of all times) of time the event has persisted at the station
Column 3: No.
Number of incidents of the event
Bar chart: The upper (blue) bar represents the percentage of the event in relation to the
total number of events encountered (frequency of events).
The lower (red) bar represents the time percentage of the event in relation to the
evaluation period.
NOTE
If more stations exist than can be displayed in the view area, a scroll bar appears above the info line per-
mitting the display area to be scrolled.
- Exiting from the "Distribution of events" evaluation
● Click on the icon.
The "Availability" evaluation is redisplayed.
User Manual Line Computer UNIX 16 MaDaMaS
Software Version 501.xx 01/99 Issue 16.2 MaDaMaS Evaluation User Interface
16 - 27
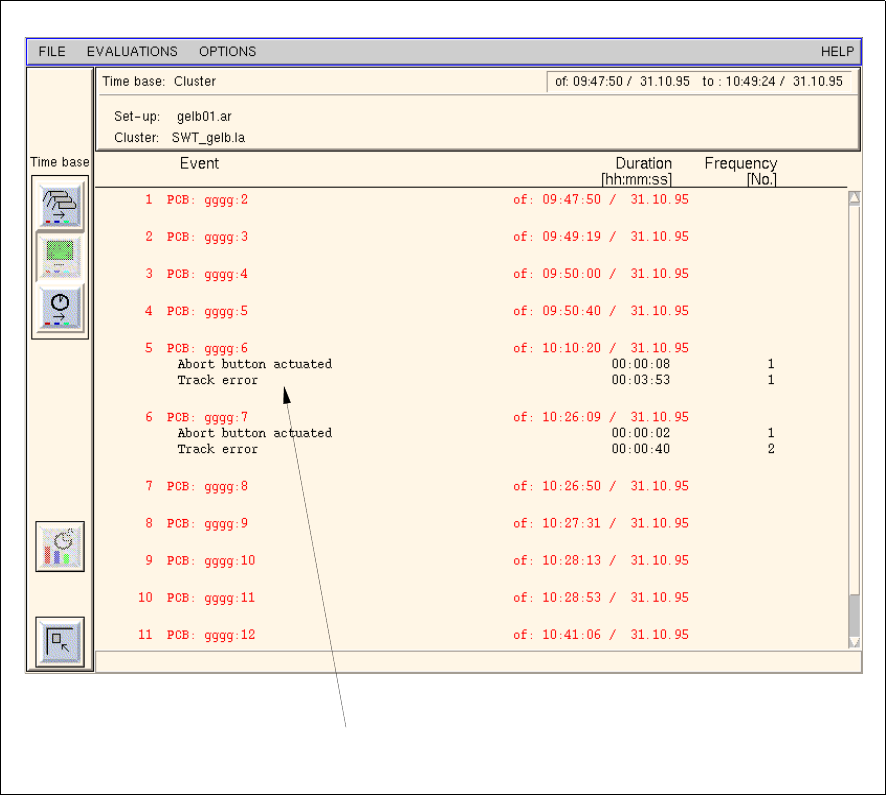
16.2.8.6 "List of events" Evaluation
The "List of events" evaluation contains a list of all PCBs produced by the selected station. For each PCB the
events that occurred during the assembly are listed. Only those events are listed that are assigned to the status
"Interrupted" or "Failed".
The "List of events" evaluation is called up from the "Availability" chart. It is only available for the individual
stations.
- Calling up the "List of events" evaluation for a station
● Click into the free space of the field below the "Availability" chart of the desired station (see
Fig. 16.2.5).
The List of events is displayed for the selected station (see Fig. 16.2.7).
Fig. 16.2.7 Evaluation user interface - "List of events" evaluation for a station
event
16 MaDaMaS User Manual Line Computer UNIX
16.2 MaDaMaS Evaluation User Interface Software Version 501.xx 01/99 Issue
16 - 28
Explanation of the List of events:
For each event that occurred during the evaluation period a line containing three columns is displayed.
Column 1: Event
Name of the event (shutdown cause)
Column 2: Duration [hh:min:ss]
Duration of the event (shutdown of the station) during the assembly of the
PCB specified in hours/minutes/seconds
Column 3: No.
Number of times an event has occurred during the assembly of the PCB
- Exiting from the "List of events" evaluation
● Click on the icon.
The "Availability" evaluation is redisplayed.
16.2.8.7 "System Diagram" Evaluation
The "System Diagram" evaluation depicts the time percentages of the various states of the individual stations
over the selected evaluation period (= time basis). Moreover, general informationen and production figures are
listed as well.
The system diagram is mainly of significance to the operating personnel as it displays important information
about every station thus allowing any troublespots and load imbalances to be identified at an early stage.
The "System Diagram" evaluation is called up from the "Availability" chart. It is available for all stations.
- Calling up the "System Diagram" evaluation for all stations
● In the overall view click on the icon in the "Availability" chart.
The System Diagram including all stations of the line is displayed (see Fig. 16.2.8).