00191413-01.pdf - 第520页
16 MaDaMaS User Manu al Line Computer UNIX 16.2 MaDaMaS Evaluation User Interface Software Version 501.xx 01/99 Issue 16 - 24 16.2.8.4 MTTR (Mean Time To Repair) The average tim e required to elim inate a malf unction is…
User Manual Line Computer UNIX 16 MaDaMaS
Software Version 501.xx 01/99 Issue 16.2 MaDaMaS Evaluation User Interface
16 - 23
16.2.8.3 MTBI (Mean Time Between Interrupts)
The average time (in minutes) between the occurrence of two malfunctions is referred to as MTBI ( Mean Time
B
etween Failures). It can be called up for the entire line or for each individual station. It is displayed - for the
entire line or for each station - below the "Availability" (see Fig. 16.2.1 and Fig. 16.2.5) chart.
The MTBI is calculated as follows:
T
b
= total operating time of the machine, or time basis for the evaluation period
T
at
= machine-related technical downtimes, e.g. unidentified reason, fiducial error, nozzle error,
transport error, barcode reading error (see also page 16 - 3)
T
ap
= operator-related interruptions
- Calling up MTBI for the line
● On the menu bar select EVALUATIONS --> Overall view.
The "Overall view" evaluation is displayed.
The value for the MTBI is displayed in minutes below the "Availability" chart
(see Fig. 16.2.1).
NOTE
The MTBI values cannot be calculated until shutdowns due to technical reasons have occurred
(see formula above). As entry for the MTBI value only a dash "-" is displayed.
- Calling up MTBI for all stations
● On the menu bar select EVALUATIONS --> Availability.
Or else:
● Click on the yellow bar in the "Availability" chart in the Overall View.
The "Availability" evaluation is displayed for all stations.
The MTBI value is displayed in minutes below the "Availability" chart
(see Fig. 16.2.5).
T
b
-T
at
-T
ap
MTBI =
no. of downtimes due to techn. reasons
16 MaDaMaS User Manual Line Computer UNIX
16.2 MaDaMaS Evaluation User Interface Software Version 501.xx 01/99 Issue
16 - 24
16.2.8.4 MTTR (Mean Time To Repair)
The average time required to eliminate a malfunction is referred to as MTTR ( Mean Time To Repair). It can be
called up for the entire line or for each individual station. It is displayed - for the entire line or for each station -
below the "Availability" chart (see Fig. 16.2.1 and Fig. 16.2.5).
The MTTR is calculated as follows:
T
at
= machine-related technical downtimes, e.g. unidentified reason, fiducial error, nozzle error,
transport error, barcode reading error (see also page 16 - 3)
- Calling up MTTR for the line
● On the menu bar select EVALUATIONS --> Overall view.
The "Overall view" evaluation is displayed.
The value for the MTTR is displayed in minutes below the "Availability" chart
(see Fig. 16.2.1).
NOTE
If no data are available yet, a "0" is displayed, for plausibility reasons, as the entry for the MTTR
value.
- Calling up MTTR for all stations
● On the menu bar select EVALUATIONS --> Availability.
Or else:
● Click on the yellow bar in the "Availability" chart in the overall view.
The "Availability" evaluation is displayed for all stations.
The MTTR value is displayed in minutes below the "Availability" chart
(see Fig. 16.2.5)
T
at
MTTR =
no. of downtimes due to techn. reasons
User Manual Line Computer UNIX 16 MaDaMaS
Software Version 501.xx 01/99 Issue 16.2 MaDaMaS Evaluation User Interface
16 - 25
16.2.8.5 "Distribution of Events" Evaluation
All types of events (see section 16.1.1.1) that have occurred within the evaluation period (total period under
observation) are listed in the "Distribution of events" evaluation chart.
The duration and number of occurrences are displayed for each individual event. Moreover, the time percentage
of the event in relation to the evaluation period as well as the percentage of the event in relation to the total
number of events encountered (frequency of events) are displayed in the associated bar chart.
A particular event may therefore occur very infrequently although its time percentage may be very high. On the
other hand, frequently occurring events may exist whose significance in terms of time is minimal. In this way,
primarily those shutdowns can be tracked which are caused by organizational shortcomings and corrective
actions be taken.
The "Distribution of events" evaluation is called up from the "Availability" chart. It is only available for the
individual stations.
- Calling up the "Distribution of events" evaluation for a station
● Click on the yellow bar in the "Availability" chart of the desired station
(see Fig. 16.2.5).
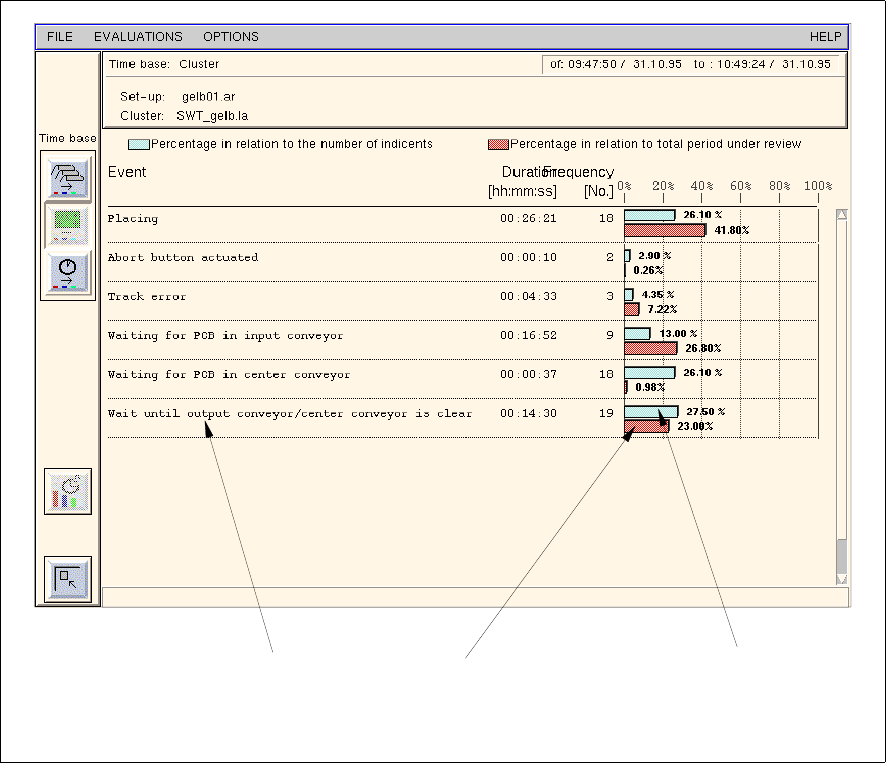
The distribution of events for the selected station is displayed (see Fig. 16.2.6).
Fig. 16.2.6 Evaluation user interface - "Distribution of events" evaluation for a station
event
time percentage of event
in relation to the
evaluation period
percentage of the event
in relation to the total
number events
encountered