00191413-01.pdf - 第504页
User Manual Line Computer UNIX 16 MaDaMaS Software Version 501.xx 01/99 Issue 16.2 MaDaMaS Evaluation User Interface 16 - 8 16.2.1 Sta rting MaDaMaS ● Clic k on th e MaDaMaS icon o n the desk top. The evalu ation us er i…
User Manual Line Computer UNIX 16 MaDaMaS
Software Version 501.xx 01/99 Issue 16.2 MaDaMaS Evaluation User Interface
16 - 7
16.2 MaDaMaS Evaluation User Interface
The logged production data can be called up from the MaDaMaS evaluation user interface.
The evaluation user interface is opened by clicking on the MaDaMaS icon on the desktop. From this user
interface a series of evaluation types can be called up by means of which the production data for a line or
individual stations can be evaluated. The display of the production data always refers to the currently set time
basis (see section 16.2.5.1).
The following global evaluations of all stations of the line are available. They are called up from the
EVALUATIONS menu (see section 16.2.3):
- Overall view: Status of the entire line, represented by means of the evaluation types
"Pick-up reliability", "Availability" and "Performance"
- Pick-up reliability: Pick-up reliability of all stations, displayed for every individual station
of a line.
- Availability: Availability of the stations, displayed for every individual station
of a line.
- Performance: Placement performance rate of all stations, displayed for every individual
station of a line.
The following evaluations are only available for the individual stations. They are called up by clicking on the
bars and symbols in the view area in each case:
- Track trend: Display ranking the eight tracks of a station with the highest error rates
(tracks with the highest rate of identity and vaccum errors).
- Track information: Display of all tracks of a station including a listing of all identity and
vacuum errors that occurred.
- System diagram: Current status display of the line or a station.
- Distribution of events: Distribution of the events on a station.
- List of events: Listing of all events that occurred for each PCB.
When MaDaMaS is opened, the "Overall view" of the entire line is displayed as the initial evaluation screen.
Another type of evaluation can be set at any time.
User Manual Line Computer UNIX 16 MaDaMaS
Software Version 501.xx 01/99 Issue 16.2 MaDaMaS Evaluation User Interface
16 - 8
16.2.1 Starting MaDaMaS
● Click on the MaDaMaS icon on the desktop.
The evaluation user interface is opened by displaying the (initial) evaluation screen "Overall view"
for the current line (see Fig. 16.2.1).
NOTE
If the area containing the bar chart icon is clicked on in a station display in the view area of the desk-
top (see chapt. 3, Fig. 3.1.2), the MaDaMaS evaluation screen will open as well.
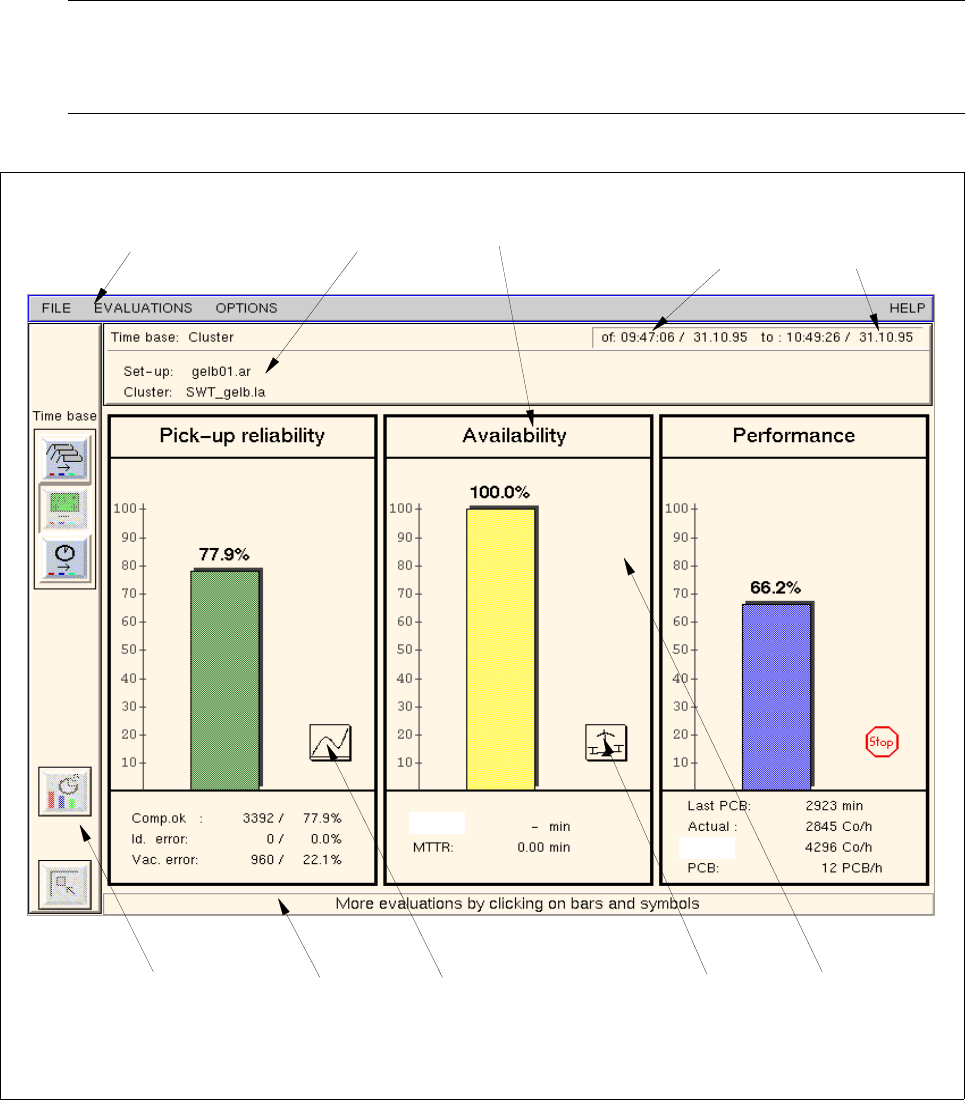
Fig. 16.2.1 Evaluation user interface - "Overall view" evaluation
menu bar
info area evaluation type
command area info line
view area
starting time
of the evaluation
end of the
evaluation
call-up of the
call-up of the
"System diagram"
evaluation
evaluation
"Track trend"
theor.:
MTBI:

User Manual Line Computer UNIX 16 MaDaMaS
Software Version 501.xx 01/99 Issue 16.2 MaDaMaS Evaluation User Interface
16 - 9
The evaluation user interface is subdivided into the following areas:
- Menu bar
- Info area
- View area
- Command area
- Info line
Menu bar
The menu bar contains the menus "FILE", "EVALUATIONS", "OPTIONS" and "HELP".
The first menu option on the "FILE" menu is explained in section 16.2.2.
The "EVALUATIONS" menu is described in section 16.2.3, the "OPTIONS" menu in section 16.2.4.
NOTE
Since the functions and the operation of the "FILE" and "HELP" menus are similar to those in other
application programs of the line computer, they are described in detail in chapt. 2 of this manual.
Info area
The following information is displayed in the info area:
- Time basis: Currently set time basis (evaluation period)
- Date and time Time of beginning and end of the evaluation
- Set-up: Name of the currently valid set-ups
- Cluster: Name of the currently valid PCBs (cluster)
View area
In most of the evaluations the view area is subdivided into a graphical area and a text area.
All the information related to the current type of evaluation that has been collected since the start time of the
evaluation, as well as the selected time basis, are displayed in these areas.
The structure of the view area and the function of the graphics and icons contained therein are described for
each evaluation in the respective sections.
NOTE
The view area is updated automatically after a PCB has exited a station or whenever a different evaluation or
time basis is selected.
An exception is the display of the "List of events". It is not updated until the "List of events" is restarted or a
new time basis is selected.
Command area (see section 16.2.5)
The command area contains three icons for the setting of the time basis, one icon for setting the Reset time
and one icon to switch the display to the previous evaluation.
Info line
This line contains a Help text or Info text related to the object the mouse cursor is pointing to.