Programming_mail.pdf - 第133页
III- 59 Programming Manual Part III Inspection Algorithm 1.15.3 Setting Procedur e Step1: Select SideLight from the Lighting drop-down list. Step2: Extract colors from two places. Component RGB values are displayed in th…
III-58
Programming Manual
Part III Inspection Algorithm
1.15 AreaColor
1.15.1 Inspection Overview
AreaColor is the algorithm to inspect the percentage of specifi ed color in the inspection window.
Extract the component color from two places in consideration of color variability.
Specify any color as OK color. If the percentage of the specifi ed color exceeds a certain value, the
result will be OK. Specify any color as NG color. If the percentage of the specifi ed color falls below a
certain value, the result will be OK.
AreaColor is suitable for copper inspection or missing inspection of chip components.
1.15.2 Parameter Setting
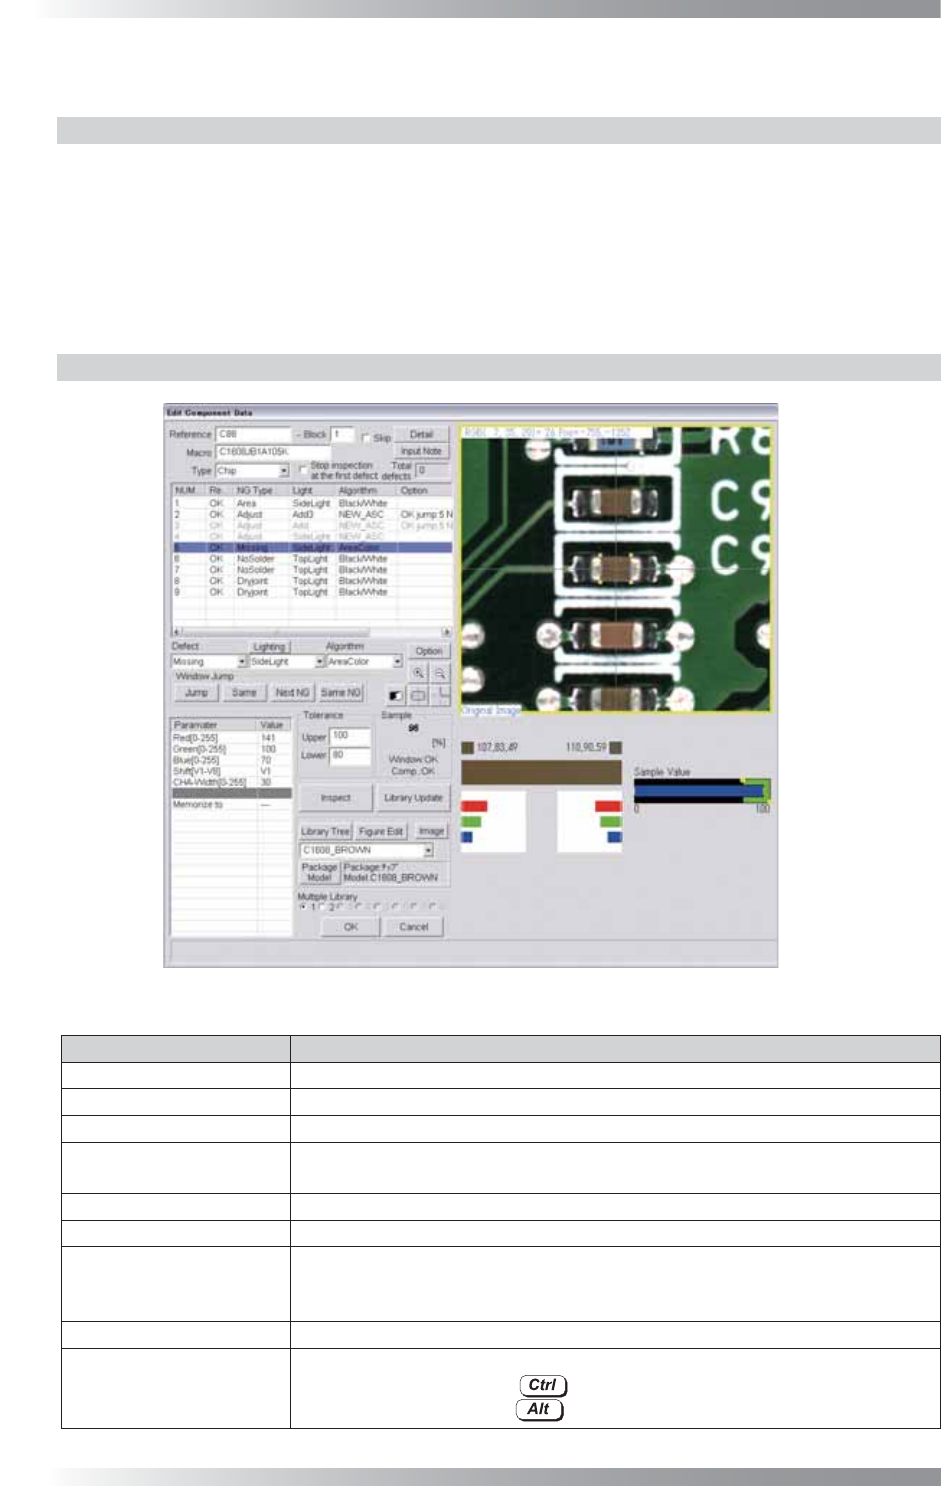
Figure 1-74 AreaColor
Parameter Description
Lighting Select SideLight.
Algorithm Select AreaColor.
Red, Green, Blue[0-255]
A value is automatically entered when component color is extracted.
Shift[V1-V8]
Enter the appropriate vector. Any value from V1 to V8 is available.
Select the vector according to the Memorize to fi eld of the Adjust window.
CHA-Width[0-255]
Default is 30. Enter the bigger value to enlarge the color OK range.
Memorize to -
Upper, Lower
If the specifi ed color is registered as OK color, enter 100 in Upper and arbitrarily
value in Lower. If the specifi ed color is registered as NG color, enter arbitrarily
value in Upper and 0 in Lower.
Sample Shows the percentage of specifi ed color in the inspection window.
The graph in the lower
right side of the dialog
Component RGB values are displayed.
By left-clicking with pressing , information is displayed on the left of the graph.
By left-clicking with pressing
,
information is displayed on the right of the graph.
Table 1-25 Parameter of AreaColor
III-59
Programming Manual
Part III Inspection Algorithm
1.15.3 Setting Procedure
Step1: Select SideLight from the Lighting drop-down list.
Step2: Extract colors from two places.
Component RGB values are displayed in the graph.
By left-clicking with pressing
, it is displayed on the left of the graph.
By left-clicking with pressing , it is displayed on the right of the graph.
NOTE
Extract colors two places to put fl exibility into OK range. One should be extracted
from dark color and another should be extracted from light color.
Step3: If the specifi ed color is registered as OK color, enter 100 in Upper and arbitrarily value in Lower.
If the specifi ed color is registered as NG color, enter arbitrarily value in Upper and 0 in Lower.
Step4: Enter the appropriate vector into the Shift fi eld. Any value from V1 to V8 is available.
Select the vector according to the Memorize to fi eld of the Adjust window.
Step5: Press Inspect. Make sure that the inspection is completed properly.
III-60
Programming Manual
Part III Inspection Algorithm
1.16 Distribution
1.16.1 Inspection Overview
Distribution is the algorithm to detect a solder bridge between leads of IC components.
Set the inspection window between leads of IC components. If a solder bridge exists between leads,
a bright line is laid across the inspection window because the solder is brighter than PCB.
The inspection window will be separated to several windows in longitudinal direction. The differences
between maximum minus minimum brightness level in each separated windows are calculated.
The sample value is the minimum value calculated among separated window (refer to Figure 1-76).
1.16.2 Parameter Setting
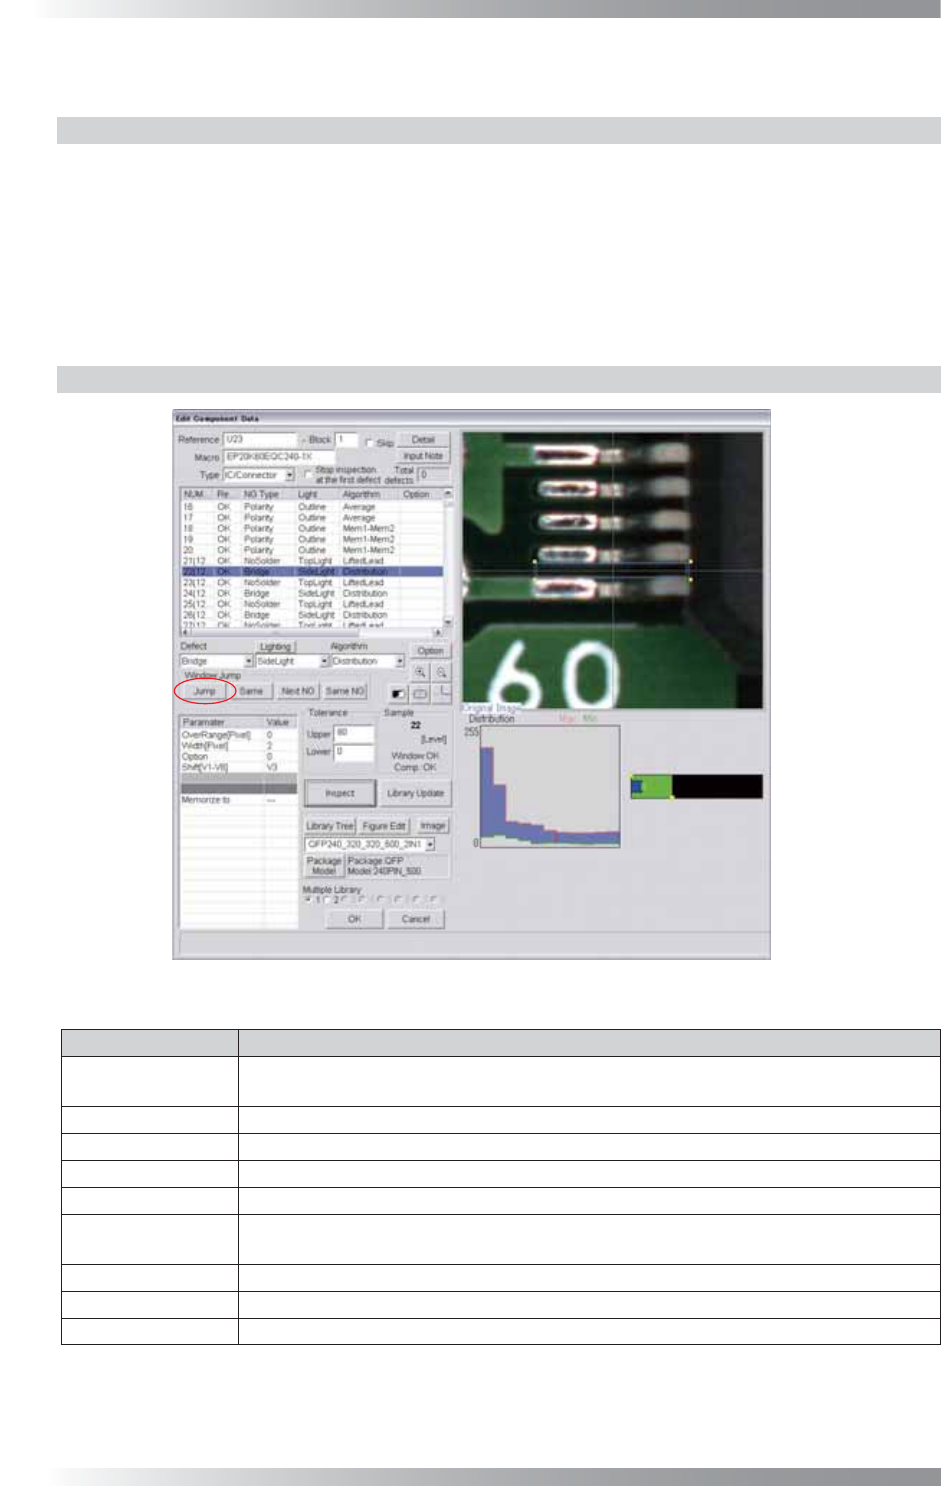
Figure 1-75 Distribution
Parameter Description
Lighting
Select SideLight. Change the lighting to LowLight, if fl ux is detected as bridge with
SideLight.
Algorithm Select Distribution.
OverRange[Pixel] Enter 0.
Width[Pixel] Default is 2. Set the bigger value to reduce noise.
Option Enter 0.
Shift[V1-V8]
Enter the appropriate vector. Any value from V1 to V8 is available.
Select the vector according to the Memorize to fi eld of the Adjust window.
Memorize to -
Upper, Lower Set upper and lower limit of the OK range.
Sample Refer to Figure 1-76.
Table 1-26 Parameter of Distribution