Programming_mail.pdf - 第82页
III- 8 Programming Manual Part III Inspection Algorithm 1.3 ColorL T r ack / ColorWT r ack 1.3.1 Inspection Ov er view ColorL T rack / ColorWT rack is the algorithm to correct misalignments between CAD data and actual co…
III-7
Programming Manual
Part III Inspection Algorithm
1.2.3 Setting Procedure
Step1: Select a lighting that displays component edges visually clear from the Lighting drop-down list.
Step2: Make sure of the values of Upper Level and Lower Level. Enter 0 in Upper Level and Lower
Level if the component brightness level is lower than the PCB. Enter 255 in Upper Level and
Lower Level if the component brightness level is higher than the PCB.
CAUTION
Select the lighting if the component edge is visually unclear with the default setting.
Step3: Enter V1, V2 and V3 into the Memorize to fi eld of each of three Adjust windows.
For details, refer to Part III 1.2.5 Algorithm V1+V2.
Step4: Press Inspect.
If the search is successful, the pink window surrounding the component’s body appears.
NOTE
The value in the Sample fi eld shows the amount of misalignment. If the Sample value
is out of the OK range, adjust the Area window position and re-check the Sample value.
CAUTION
The Adjust window can be scaled to any size by moving yellow square points in
window corners. Do not move the window position with mouse dragging.
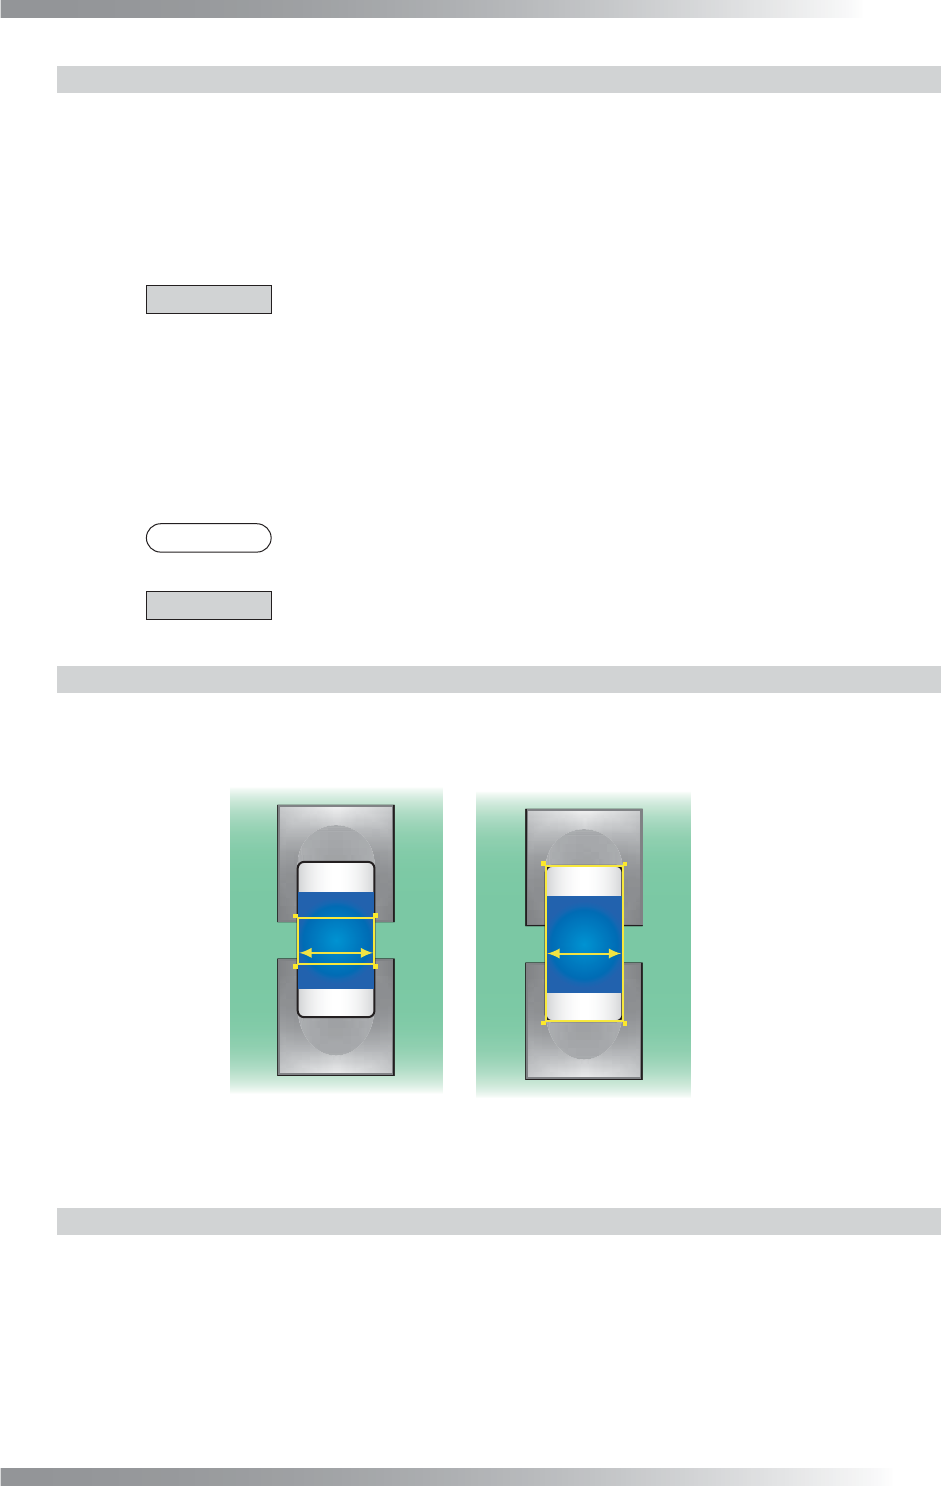
1.2.4 Difference between LTracking and WTracking
As the window shown in Figure 1-8 (a), LTracking should be used to correct longitudinal direction
misalignments of inspection windows. WTracking should be used to correct lateral direction misalignments
of inspection windows. This is the same as the difference between ColorLTrack and ColorWTrack.
㪣
㪮
Longitudinal
(a) LTracking
(b) WTracking
Lateral
Direction
Direction
Longitudinal
Direction
Lateral
Direction
Figure 1-8 Difference between LTracking and WTracking
1.2.5 Algorithm V1+V2
Three Adjust windows are necessary to correct misalignments with LTracking and WTracking.
The fi rst window calculates the amount of longitudinal direction misalignments and the second
window calculates amount of lateral direction misalignments. Enter V1 and V2 to each window’s
Memorize to fi eld. Enter V3 to the last Adjust window Memorize to fi eld.
Enter V3 in Shift to refl ect amount of misalignments to other algorithms.
III-8
Programming Manual
Part III Inspection Algorithm
1.3 ColorLTrack / ColorWTrack
1.3.1 Inspection Overview
ColorLTrack / ColorWTrack is the algorithm to correct misalignments between CAD data and actual
component positions. Actual component positions are automatically searched based on the color
differences between components and a PCB. ColorLTrack / ColorWTrack corrects misalignments (X
axis, Y axis). Extract component colors from two places in consideration of color variability (Extracted
colors should be differ from a PCB color) and register them as a criterial color.
ColorLTrack should be used to correct longitudinal direction misalignments of inspection windows.
ColorWTrack should be used to correct lateral direction misalignments of inspection windows.
ColorLTrack / ColorWTrack is suitable if a component color clearly differs from a PCB color.
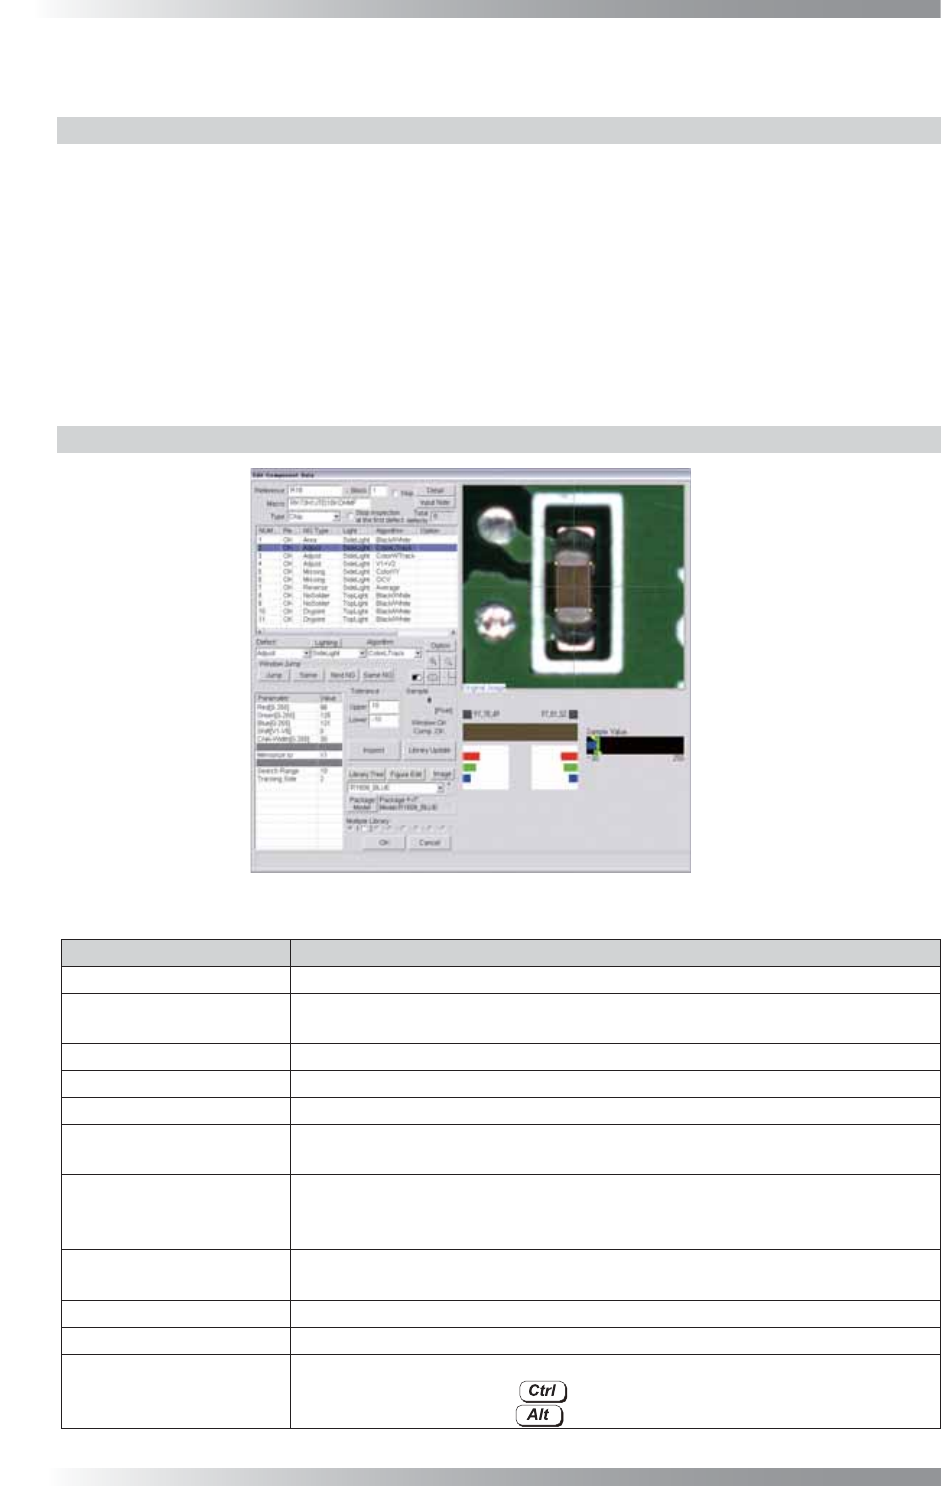
1.3.2 Parameter Setting
Figure 1-9 ColorLTrack/ColorWTrack
Parameter Description
Lighting Select SideLight.
Algorithm
Select ColorLTrack or ColorWTrack
(refer to 1.2.4 The difference between LTracking and WTracking).
Red, Green, Blue[0-255]
The value is automatically entered when a component color is extracted.
Shift[V1-V8] Enter 0.
CHA-Width[0-255]
Default is 30. Enter the bigger value to enlarge the color OK range.
Memorize to
Enter V1 to register amount of misalignments.
Enter V1 in Shift to refl ect amount of misalignments to other algorithms.
Search Range
Default is 10. Enter the bigger value to enlarge the search area.
However, if the Search Range is too large, the inspection time might become
longer or a PCB pattern might be mis-recognized as a component.
Tracking Side
Default is 2. Misalignments are corrected in both X- and Y-axis directions.
If the value is 0 or 1, misalignments in one direction are corrected.
Upper, Lower Set upper and lower limit of the OK range.
Sample
Shows amount of misalignments.
The graph in the lower
right side of the dialog
Component RGB values are displayed.
By left-clicking with pressing , information is displayed on the left of the graph.
By left-clicking with pressing
,
information is displayed on the right of the graph.
Table 1-3 Parameter of ColorLTrack / ColorWTrack
III-9
Programming Manual
Part III Inspection Algorithm
1.3.3 Setting Procedure
Step1: Select SideLignt from the Lighting drop-down list.
Step2: The Adjust window can be scaled to any size by adjusting the yellow square points on the corners
of the colored part of the chip. The window position should be adjusted in the Area window.
CAUTION
Do not move the Adjust window position by mouse-dragging.
Step3: Select two places and extract the colors.
Component RGB values are displayed in the graph.
By left-clicking with pressing , it is displayed on the left of the graph.
By left-clicking with pressing , it is displayed on the right of the graph.
NOTE
In order to expand the OK range, select one from dark colors and the other from
light colors.
Step4: Enter V1 in the Memorize to fi eld.
Step5: Press Inspect.
If the search is successful, the pink window surrounding the component’s body appears.
NOTE
A value in Sample shows amount of misalignments. If the sample value is out of the
OK range, adjust the Area window position and re-check the Sample value.