3OM-1075-002.pdf - 第196页
3. 2 "Machine Performance Data" T ab The corresponding tab sheet enables the operator to view the informa- tion on machine performance. • Sheet Layout When the "Machine Performance Data" tab is presse…
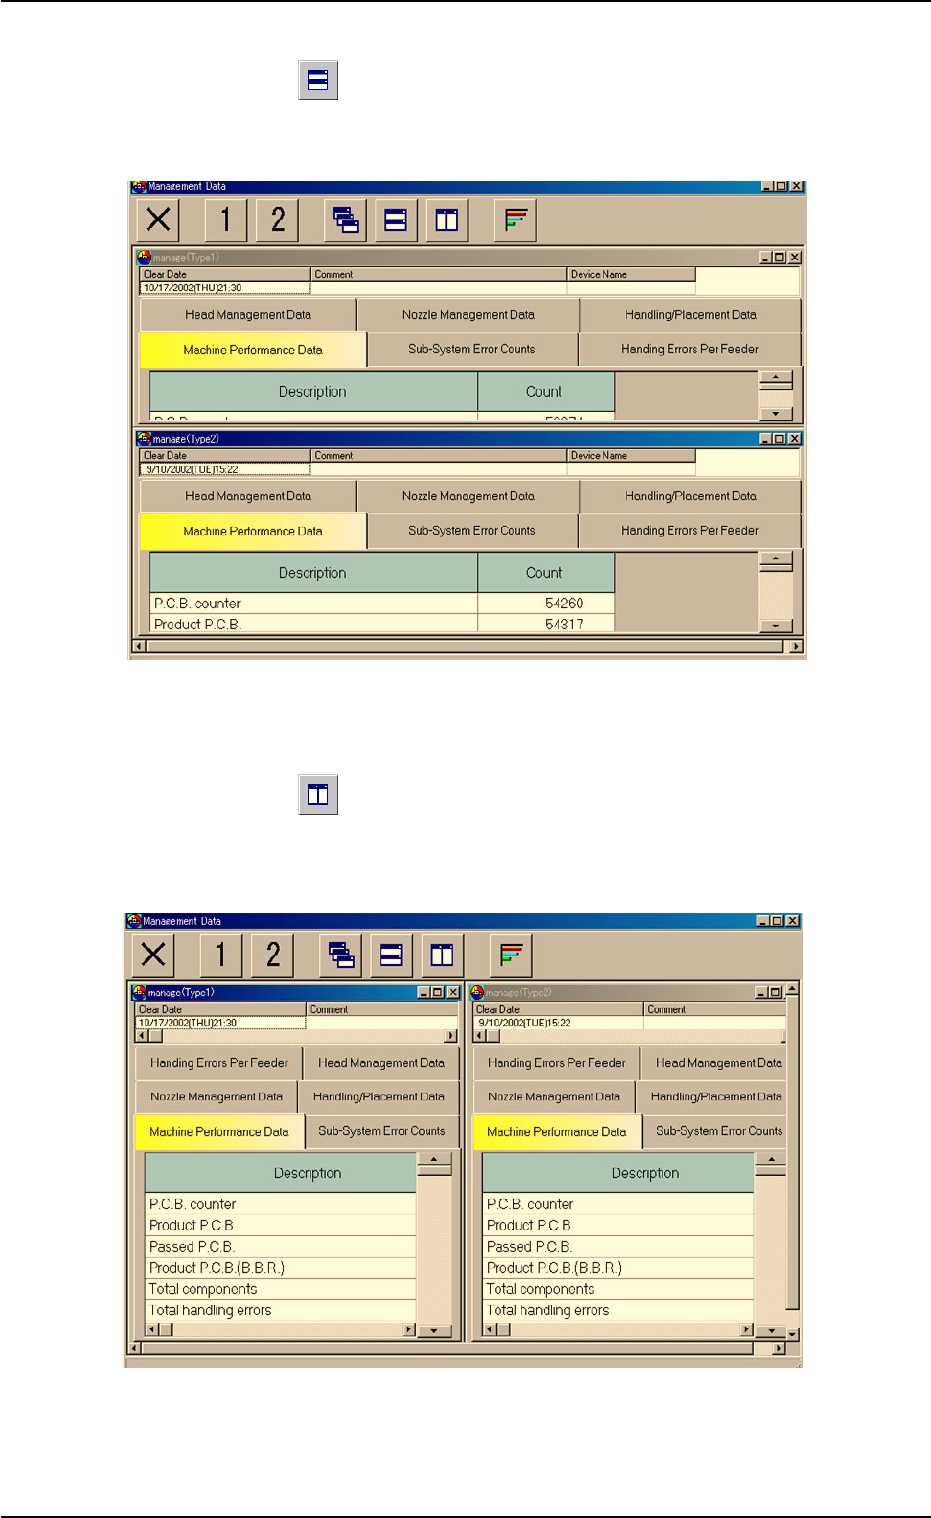
(4) How to tile two "manage (Type#)" windows horizontally
When the "
" icon is pressed, the "Management Data - [manage
(Type1)]" and "Management Data - [manage (Type2)]" windows are
re-arranged up and down.
Fig. 3D7 Horizontally Tiled Windows
(5) How to tile two "manage (Type#)" windows vertically
When the "
" icon is pressed, the "Management Data - [manage
(Type1)]" and "Management Data - [manage (Type2)]" windows are
re-arranged side by side.
Fig. 3D8 Vertically Tiled Windows
0308-003 4-12 AHB01EDTP
3.1 Basic Operations in "Management Data" Window
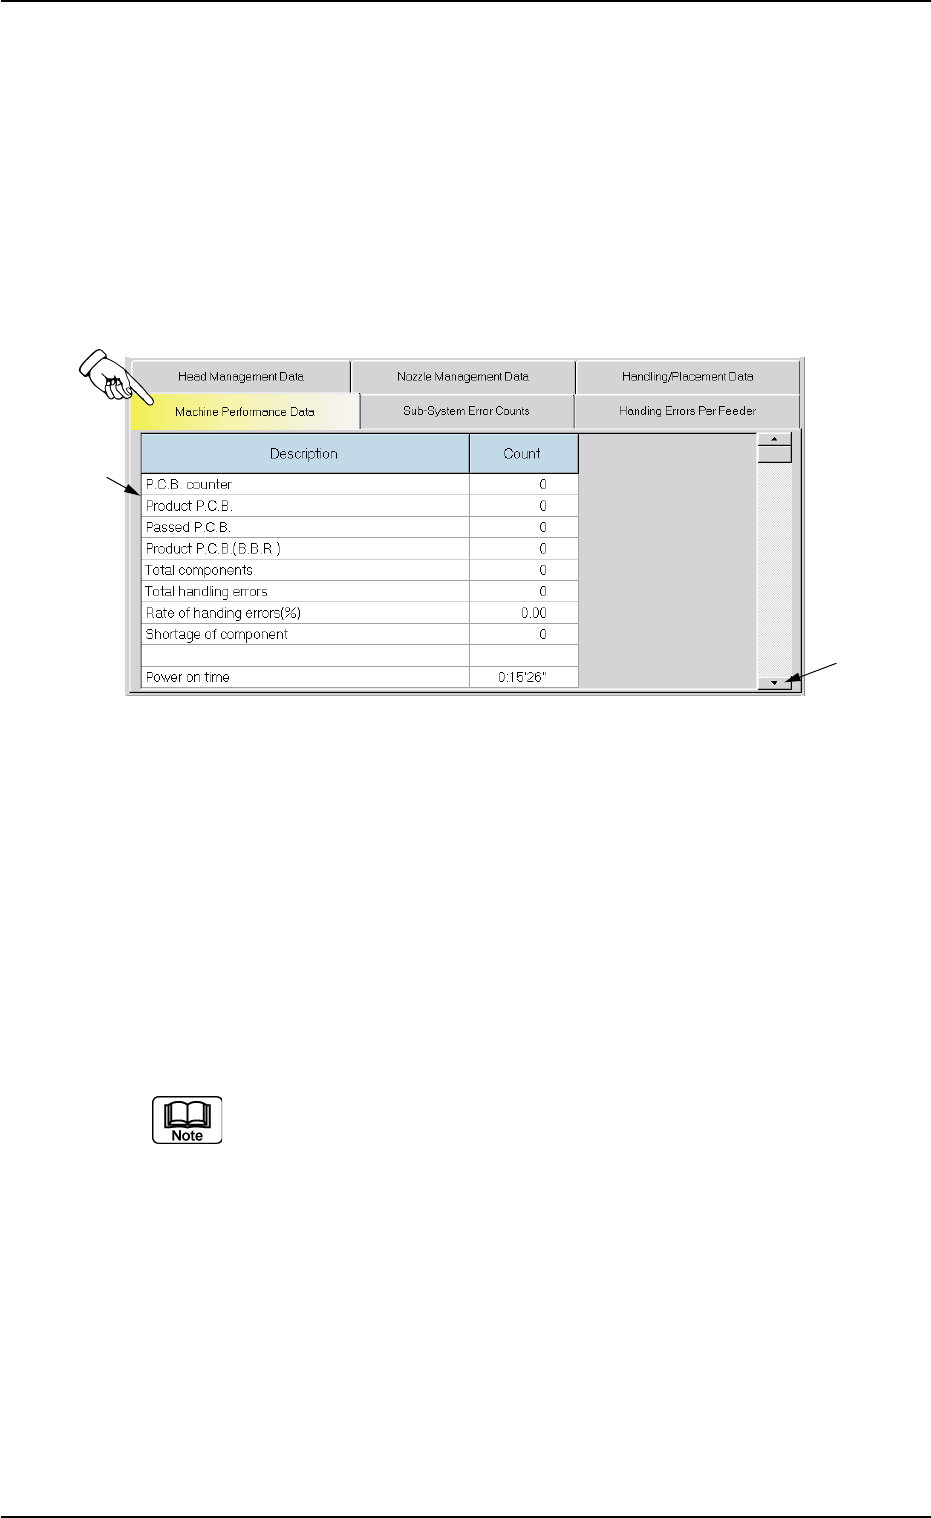
3.2 "Machine Performance Data" Tab
The corresponding tab sheet enables the operator to view the informa-
tion on machine performance.
• Sheet Layout
When the "Machine Performance Data" tab is pressed in the "Man-
agement Data" window, the following tab sheet appears inside the
window.
Fig. 3D9 "Machine Performance Data" Tab Sheet
• Sheet Composition
*1 Items
The following items are displayed.
(1) P.C.B. counter
Shown is the number of produced P.C.B.’s.
Counting is implemented when the X/Y beam is zeroed after com-
ponent placement operation (when a P.C.B. is finished).
When a pattern program is set several times as the current
program, the sum total is computed.
(2) Product P.C.B.
The number of produced unit P.C.B.’s on a multi-unit P.C.B. is
summed up. Counting is implemented when a unit P.C.B. is fin-
ished and the X/Y table returns to its origin.
When the bad board reject (B.B.R.) function (option) is used, de-
fective unit P.C.B.’s are excluded.
3.2 "Machine Performance Data" Tab
01 12-001 4-13 AHB01EDTP
*1
*2

(3) Passed P.C.B.
The number of passed P.C.B.’s is counted when the machine is
set in the "PASS" mode.
Counting is implemented when the P.C.B. on the P.C.B. position-
ing section is transferred onto the output conveyor.
(4) Product P.C.B. (B.B.R.)
Shown is the number of defective P.C.B.’s summed up when the
bad board reject function (option) is used.
(5) Total components
Shown is the number of picked components (the number of pick-
up operations).
(6) Total handling errors
Shown is the total number of component handling errors.
(7) Rate of handling errors (%)
Shown is the percentage of handling errors per total number of
picked components.
(8) Shortage of component
Shown is the number of component shortage errors.
(9) Power on time
Shown is the time when the control power of the machine is ON.
Sample Display
10:03' 50" (10 hours, 3 minutes, and 50 seconds)
Auto run time
Shown is the time when the machine was running automatically.
When a pattern program is set as the current one several times,
the sum total is computed.
Placement time
Shown is the time required to finish a P.C.B. (from the first to the
last component placement on one product P.C.B.).
The essential component placement time is summed up. While
the machine is set in the "STOP" or the "PAUSE" mode or a step
operation is performed, the time is not measured.
This is used to calculate the average placement tact time per
component.
3.2 "Machine Performance Data" Tab
01 12-001 4-14 AHB01EDTP