3OM-1075-002.pdf - 第203页
3 . 4 "Handling Errors Per Feeder" T ab The corresponding tab sheet enables the operator to view the handling errors on each individual feeders. • Sheet Layout When the "Handling Errors Per Feeder" ta…
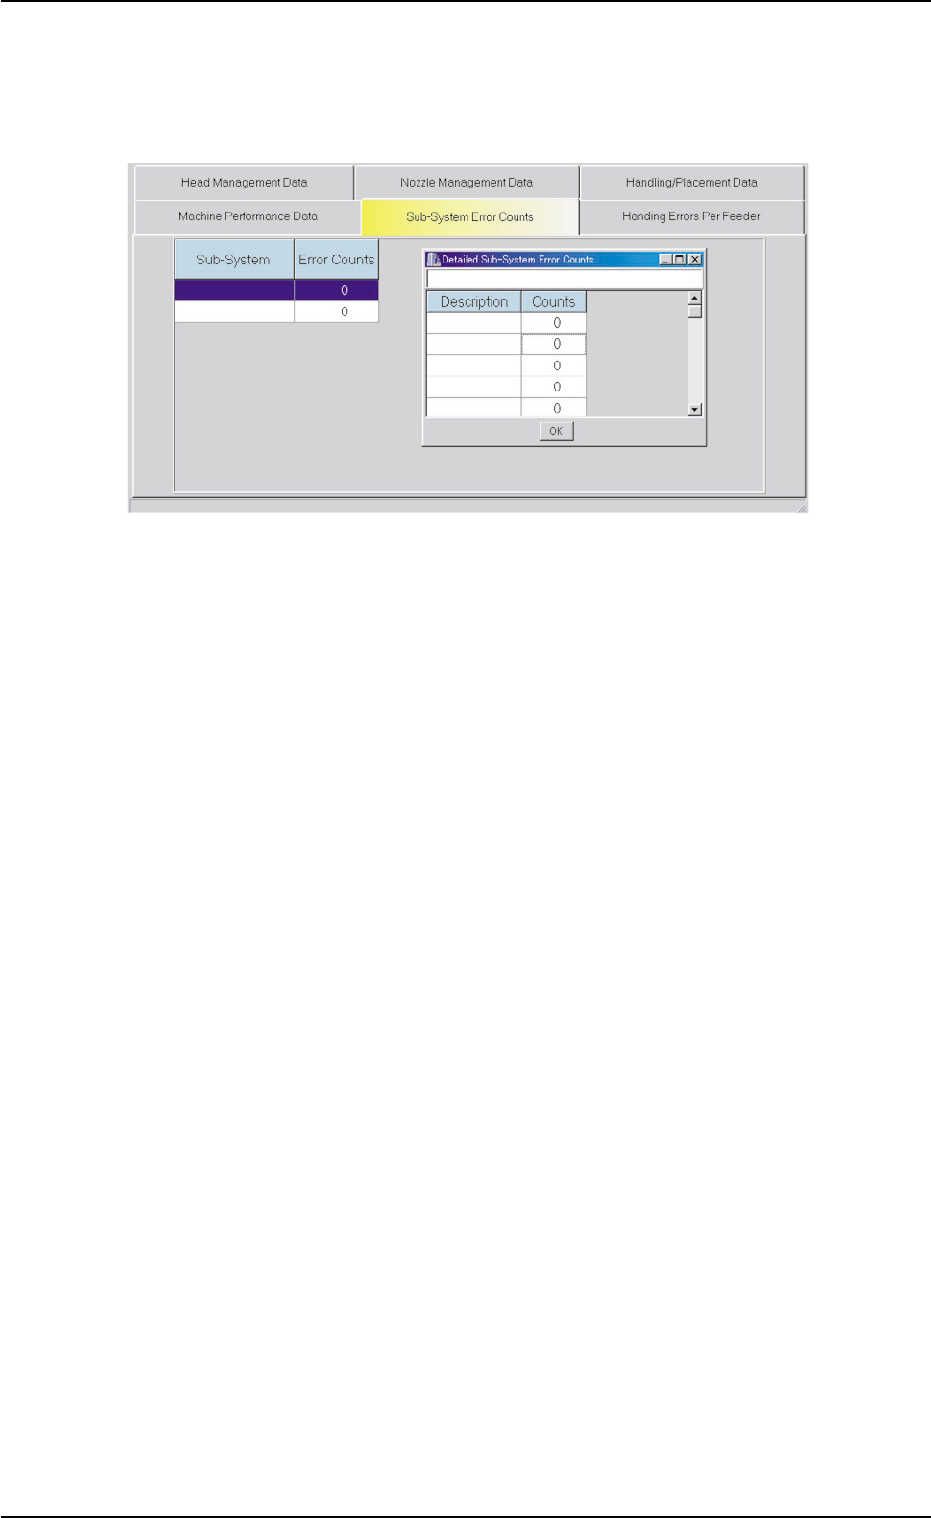
• How to view the details
When the device line is pressed to view the details, the "Detailed Sub-
System Error Counts" window opens.
Fig. 3D11 "Detailed Sub-System Error Counts" Window
The "Detailed Sub-System Error Counts" window displays the number
of errors that have occurred in each error-caused spot of the selected
device.
When the [OK] button is pressed in the "Detailed Sub-System Error
Counts" window, the "Detailed Sub-System Error Counts" window
closes.
01 12-001 4-19
AHB01EDTP
3.3 "Sub-System Error Counts" Tab
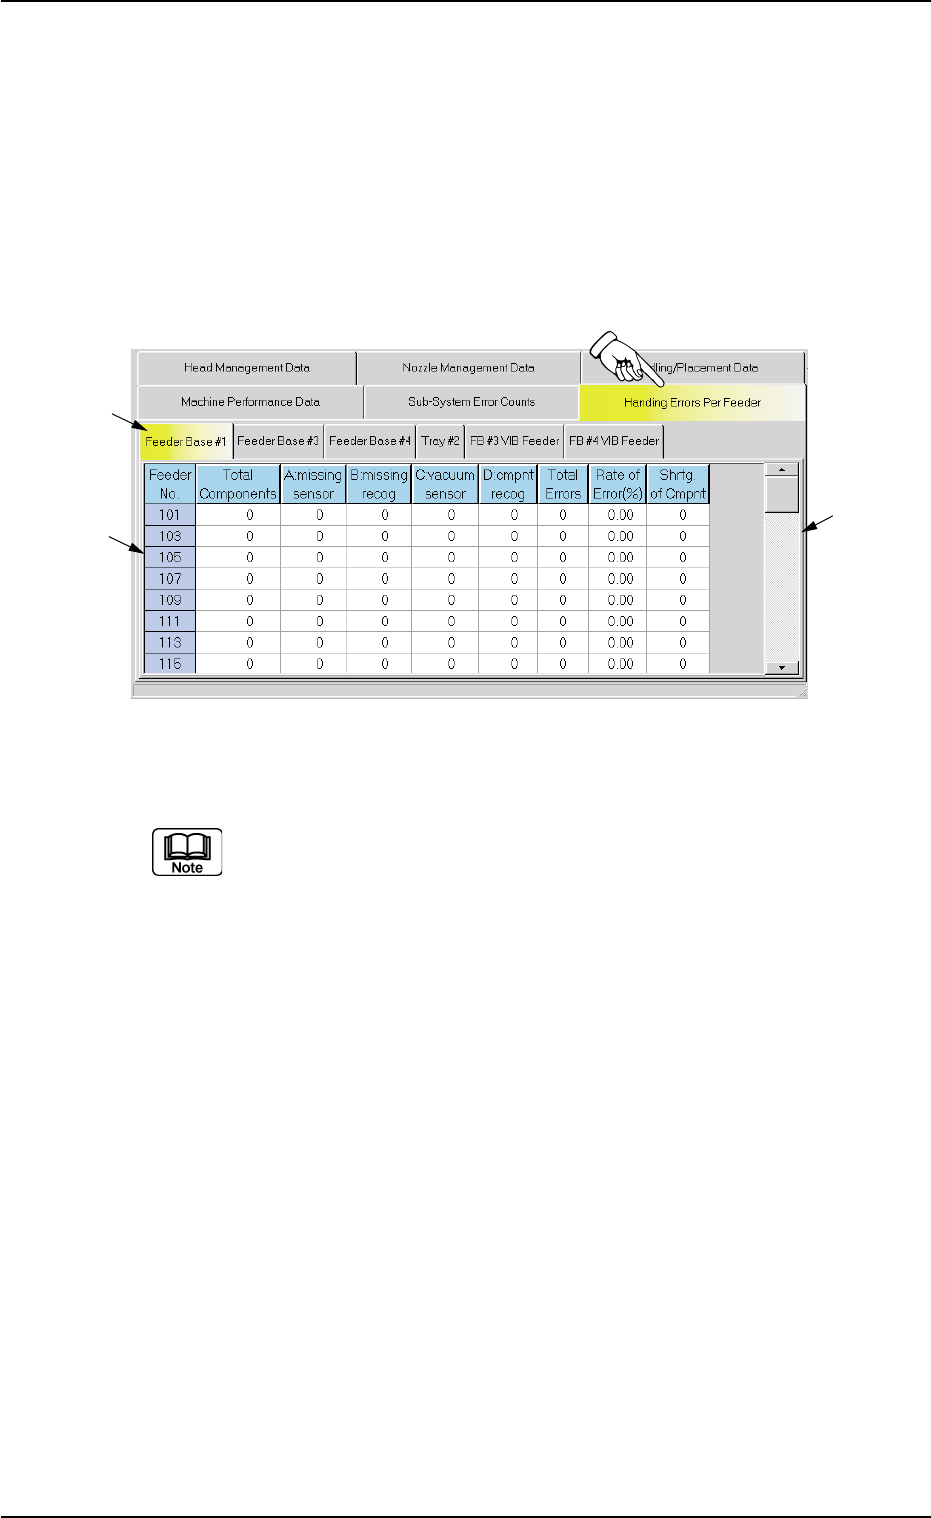
3.4 "Handling Errors Per Feeder" Tab
The corresponding tab sheet enables the operator to view the handling
errors on each individual feeders.
• Sheet Layout
When the "Handling Errors Per Feeder" tab is pressed in the "Manage-
ment Data" window, the following tab sheet appears inside the window.
Fig. 3D12 "Handling Errors Per Feeder" Tab Sheet
(Provided with Multi-Layer Tray Feeder 2)
The tab sheet may look different, depending on which options
are selected.
• Sheet Composition
*1 "Feeder Base #" Tabs
The "Handling Errors Per Feeder" tab sheet is divided further into
several tab sheets and each tab sheet shows the handling errors
per feeder on each individual feeder bases and trays.
When a tab is pressed, the corresponding tab sheet appears, indi-
cating that the related feeder base or tray is selected.
*2 Items
The following items are displayed.
(1) [Feeder No.] Button
Shown are the feeder Nos.
(2) [Total Components] Button
Each text box shows the total number of picked components (num-
ber of pick-up actions) for each individual feeders.
01 12-001 4-20
AHB01EDTP
*1
*3
*2
3.4 "Handling Errors Per Feeder" Tab

(3) [A: missing sensor] Button
Each text box shows the total number of component missing er-
rors detected by the vacuum sensor for each individual feeders.
(4) [B: missing recog] Button
Each text box shows the total number of component missing er-
rors detected through recognition operation for each individual
feeders.
(5) [C: vacuum sensor] Button
Each text box shows the total number of component pick-up er-
rors detected by the vacuum sensor (errors not detected through
the component recognition) for each individual feeders.
(6) [D: cmpnt recog] Button
Each text box shows the total number of errors detected through
recognition operation for each individual feeders.
(7) [Total Errors] Button
Each text box shows the total number of errors detected in (3)
through (6).
(8) [Rate of Error (%)] Button
Each text box shows the percentage of the total number of errors
per the number of picked components.
(9) [Shrtg. of Cmpnt] Button
Each text box shows the total number of component shortage
errors detected for each individual feeders.
When one of the above buttons is pressed, the feeder No. with
the biggest parameter under the selected button is displayed in
the first line and feeder Nos. having the subsequent (second,
third, fourth, ...) biggest parameters follow. That is, parameters
are re-arranged in order of error counts, making it easy to ana-
lyze and improve production rate.
When the [Feeder No.] button is pressed, feeder Nos. are ar-
ranged in their initial order (order of slot Nos.).
*3 Vertical Scroll Bar
Up and down arrows are located at both ends of a scroll bar. The up
or the down arrow can be pressed to scroll up or down a tab sheet
to expose hidden parameters (data for the hidden feeder Nos.).
3.4 "Handling Errors Per Feeder" Tab
01 12-001 4-21 AHB01EDTP