3OM-1075-002.pdf - 第205页
3 . 5 "Head Management Data" T ab The corresponding tab sheet enables the operator to view the head management data for each individual heads. • Sheet Layout When the "Head Management Data" tab is pre…

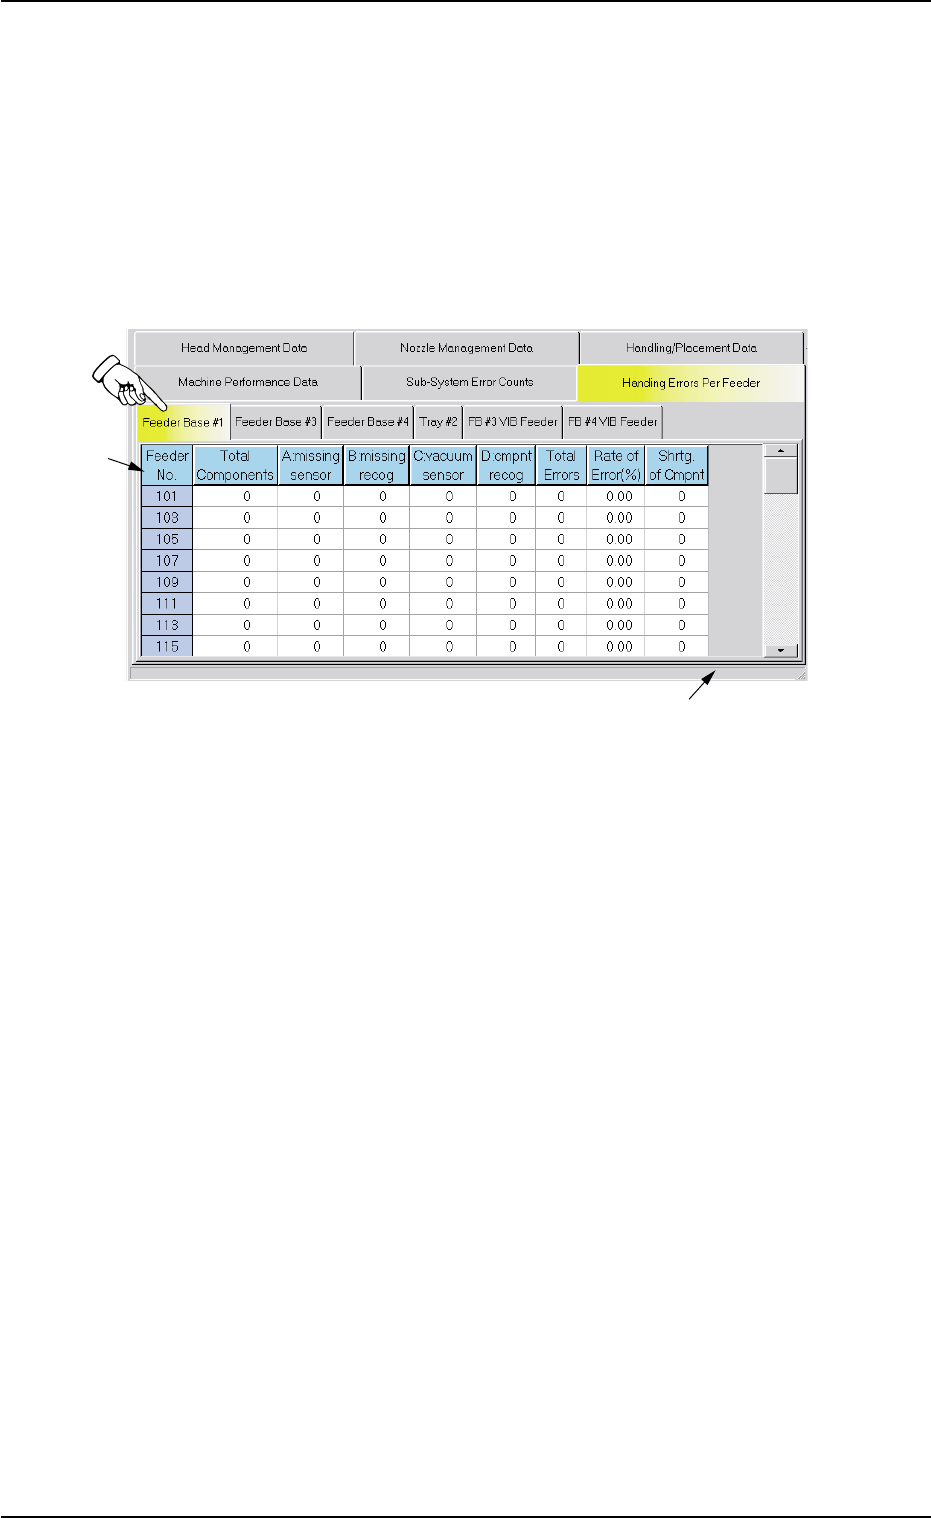
(3) [A: missing sensor] Button
Each text box shows the total number of component missing er-
rors detected by the vacuum sensor for each individual feeders.
(4) [B: missing recog] Button
Each text box shows the total number of component missing er-
rors detected through recognition operation for each individual
feeders.
(5) [C: vacuum sensor] Button
Each text box shows the total number of component pick-up er-
rors detected by the vacuum sensor (errors not detected through
the component recognition) for each individual feeders.
(6) [D: cmpnt recog] Button
Each text box shows the total number of errors detected through
recognition operation for each individual feeders.
(7) [Total Errors] Button
Each text box shows the total number of errors detected in (3)
through (6).
(8) [Rate of Error (%)] Button
Each text box shows the percentage of the total number of errors
per the number of picked components.
(9) [Shrtg. of Cmpnt] Button
Each text box shows the total number of component shortage
errors detected for each individual feeders.
When one of the above buttons is pressed, the feeder No. with
the biggest parameter under the selected button is displayed in
the first line and feeder Nos. having the subsequent (second,
third, fourth, ...) biggest parameters follow. That is, parameters
are re-arranged in order of error counts, making it easy to ana-
lyze and improve production rate.
When the [Feeder No.] button is pressed, feeder Nos. are ar-
ranged in their initial order (order of slot Nos.).
*3 Vertical Scroll Bar
Up and down arrows are located at both ends of a scroll bar. The up
or the down arrow can be pressed to scroll up or down a tab sheet
to expose hidden parameters (data for the hidden feeder Nos.).
3.4 "Handling Errors Per Feeder" Tab
01 12-001 4-21 AHB01EDTP
3.5 "Head Management Data" Tab
The corresponding tab sheet enables the operator to view the head
management data for each individual heads.
• Sheet Layout
When the "Head Management Data" tab is pressed in the "Management
Data" window, the following tab sheet appears inside the window.
Fig. 3D13 "Head Management Data" Tab Sheet
• Sheet Composition
*1 Items
The following items are displayed.
(1) [Head-Noz.] Button
Shown are the nozzle Nos. (1 through 6) on each head No. (1 and
2).
(2) [Total Components] Button
Each text box shows the number of picked components.
(3) [A: missing sensor] Button
Each text box shows the number of component missing errors
detected by the vacuum sensor.
(4) [B: missing recog] Button
Each text box shows the number of component missing errors
detected through component recognition.
3.5 "Head Management Data" Tab
01 12-001 4-22 AHB01EDTP
*1
*2

(5) [C: vacuum sensor] Button
Each text box shows the total number of component pick-up er-
rors detected by the vacuum sensor (errors not detected through
the component recognition) for each individual feeders.
(6) [D: cmpnt recog] Button
Each text box shows the number of component recognition er-
rors.
(7) [Total Errors] Button
Each text box shows the total number of errors in (3) through (6).
(8) [Rate of Error (%)] Button
Each text box shows the percentage of error per number of picked
components.
(9) [Head Clear/Change Date] Button
Each text box shows the clear date for each individual heads.
(based on head bypassing, etc.)
When one of the above buttons is pressed, the feeder No. with
the biggest parameter under the selected button is displayed in
the first line and feeder Nos. having the subsequent (second,
third, fourth, ...) biggest parameters follow. That is, parameters
are re-arranged in order of error counts, making it easy to ana-
lyze and improve production rate.
When the [Head No.] button is pressed, head Nos. are arranged
in their initial order (order of head Nos.).
3.5 "Head Management Data" Tab
01 12-001 4-23 AHB01EDTP