Omron V-TS Teaching Manual.pdf.pdf - 第171页
Chapter 2 Insp ection Progr amming 2- 144 The cu rrently set inspection criteria values ar e displayed in a blue region. OK sh ows the thumbnails where the visual check result is not entered (nor m al), and NG the thumbn…
2.15 Modifying an Inspection Program
2-143
(8) Visual Check Result
Select the visual check result for the thumbnail to display.
Click [(Display All)] to display all thumbnails regardless of the visual check result.
Click [(Blank)] to display only thumbnail(s) without a visual check result.
Click [None] to display only thumbnail(s) with the visual check result as None.
Click [OK] to display only the thumbnails whose visual check result is "OK".
Click [Acceptable] to display only the thumbnails whose visual check result is "Acceptable".
Click [NG] to display only the thumbnail whose visual check result for any of the inspection
items is "NG".
(9) Thumbnail Type
Select the thumbnail type to display.
Click [(Display All)] to display all thumbnails regardless of type.
Click [Model] to display only the tumbnails registered as models using captured PCB images.
Click [Mask Model] to display only mask model thumbnail(s).
Click [PCB Test Result] to display only thumbnails created from the PCB test result.
Click [Mass Production Image] to display only thumbnails registered using mass production
images.
Click [Mass Production Image (not registered)] to display only thumbnails for which a model
has not been registered using mass production images.
Click [Adjust] to display only the thumbnails obtained by the adjusted images.
(10) Sort
Clicking the list header sorts the thumbnails for each item.
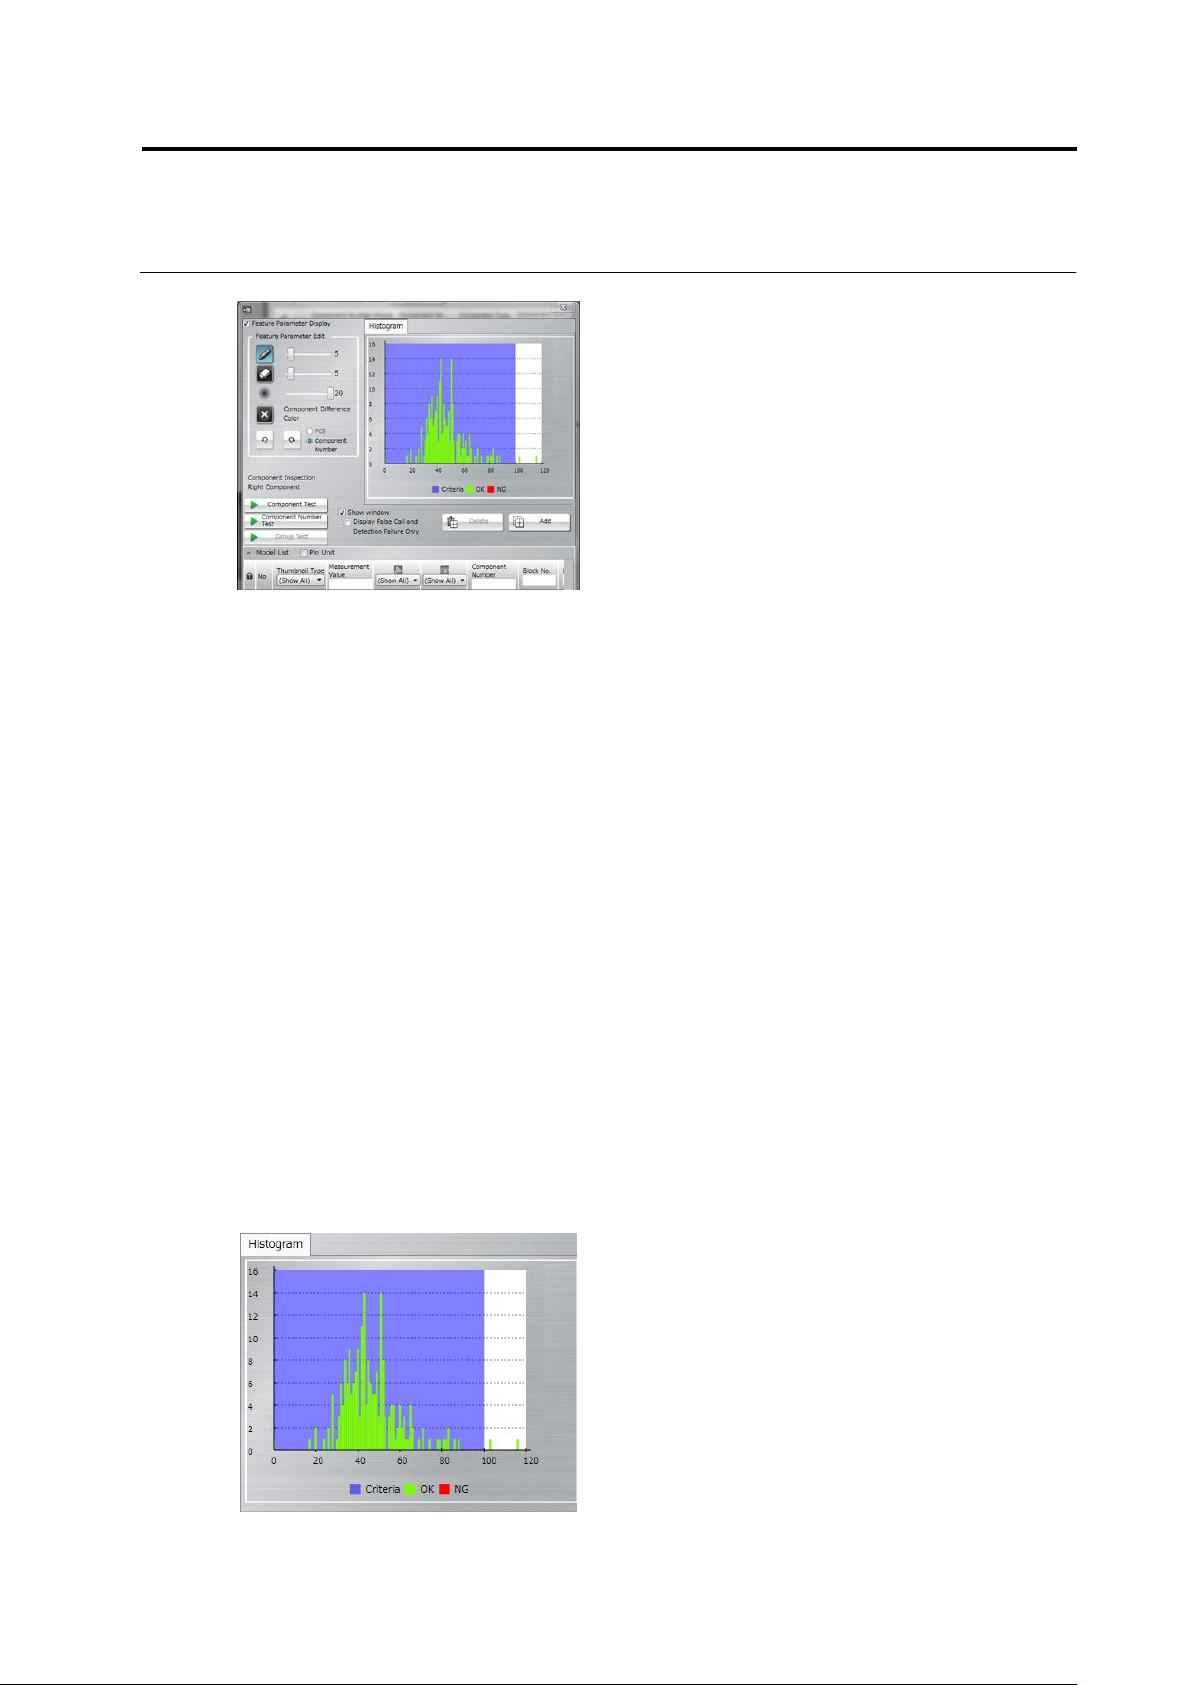
(11) Histogram
When a test is peformed, the measured values of the thumbnails to display are shown in a
histogram.
(11)
(8)
(9)
(10)
Chapter 2 Inspection Programming
2-144
The currently set inspection criteria values are displayed in a blue region.
OK shows the thumbnails where the visual check result is not entered (normal), and NG the
thumbnails where the visual check result has already been entered (actually faulty).
Measured values are displayed on the histogram only for the inspection items with which a
measured value is present.
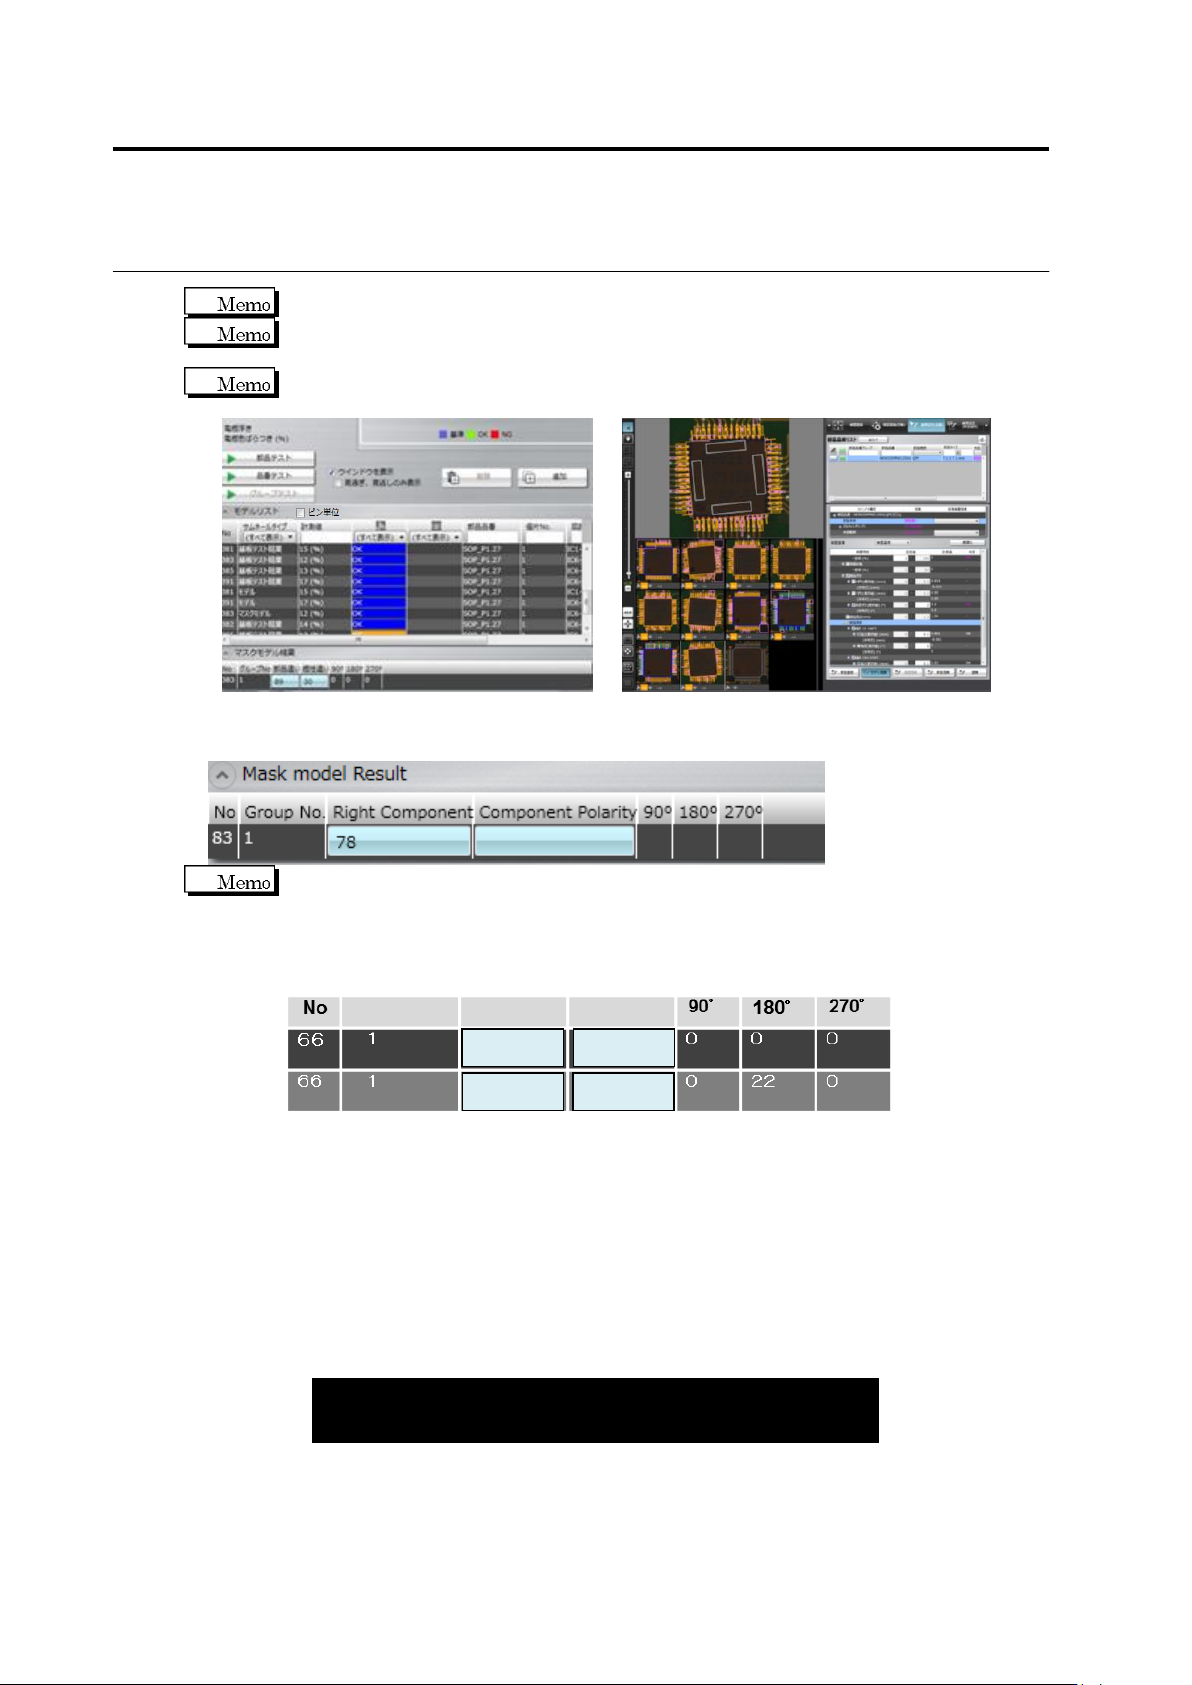
(12) Mask model result
List of the measured values per mask model is displayed.
The relation of measured values of multiple models in polarity inspection is
explained as follows:
The measured value of wrong polarity means the measured value of zero degree,
displayed according to 1) the calculation formula of wrong polarity measured values
and 2) the matching rate of each revolved model.
(1) Calculation formula of wrong polarity measured value
Measured value of 0° = [Matching rate of 0°] - [Maximum matching rate of other
angles (90°,180°, or 270°)]
Measured values are also displayed for each revolved model of other angles (90°,
180°, or 270°).
(2) Matching rate of each revolved model
When measured values are calculated, matching rate (%) is processed internally.
Examples of each revolved model (0°, 90°, 180°, or 270°) are as follows:
Wrong polarity
(0°)
90°
180°
270°
Model 1
85
39
71
45
Model 2
60
62
84
50
85
84
14
0
Group No
Wrong Compo.
Wrong Polarity
(15)
(12)
(14)
(13)
2.15 Modifying an Inspection Program
2-145
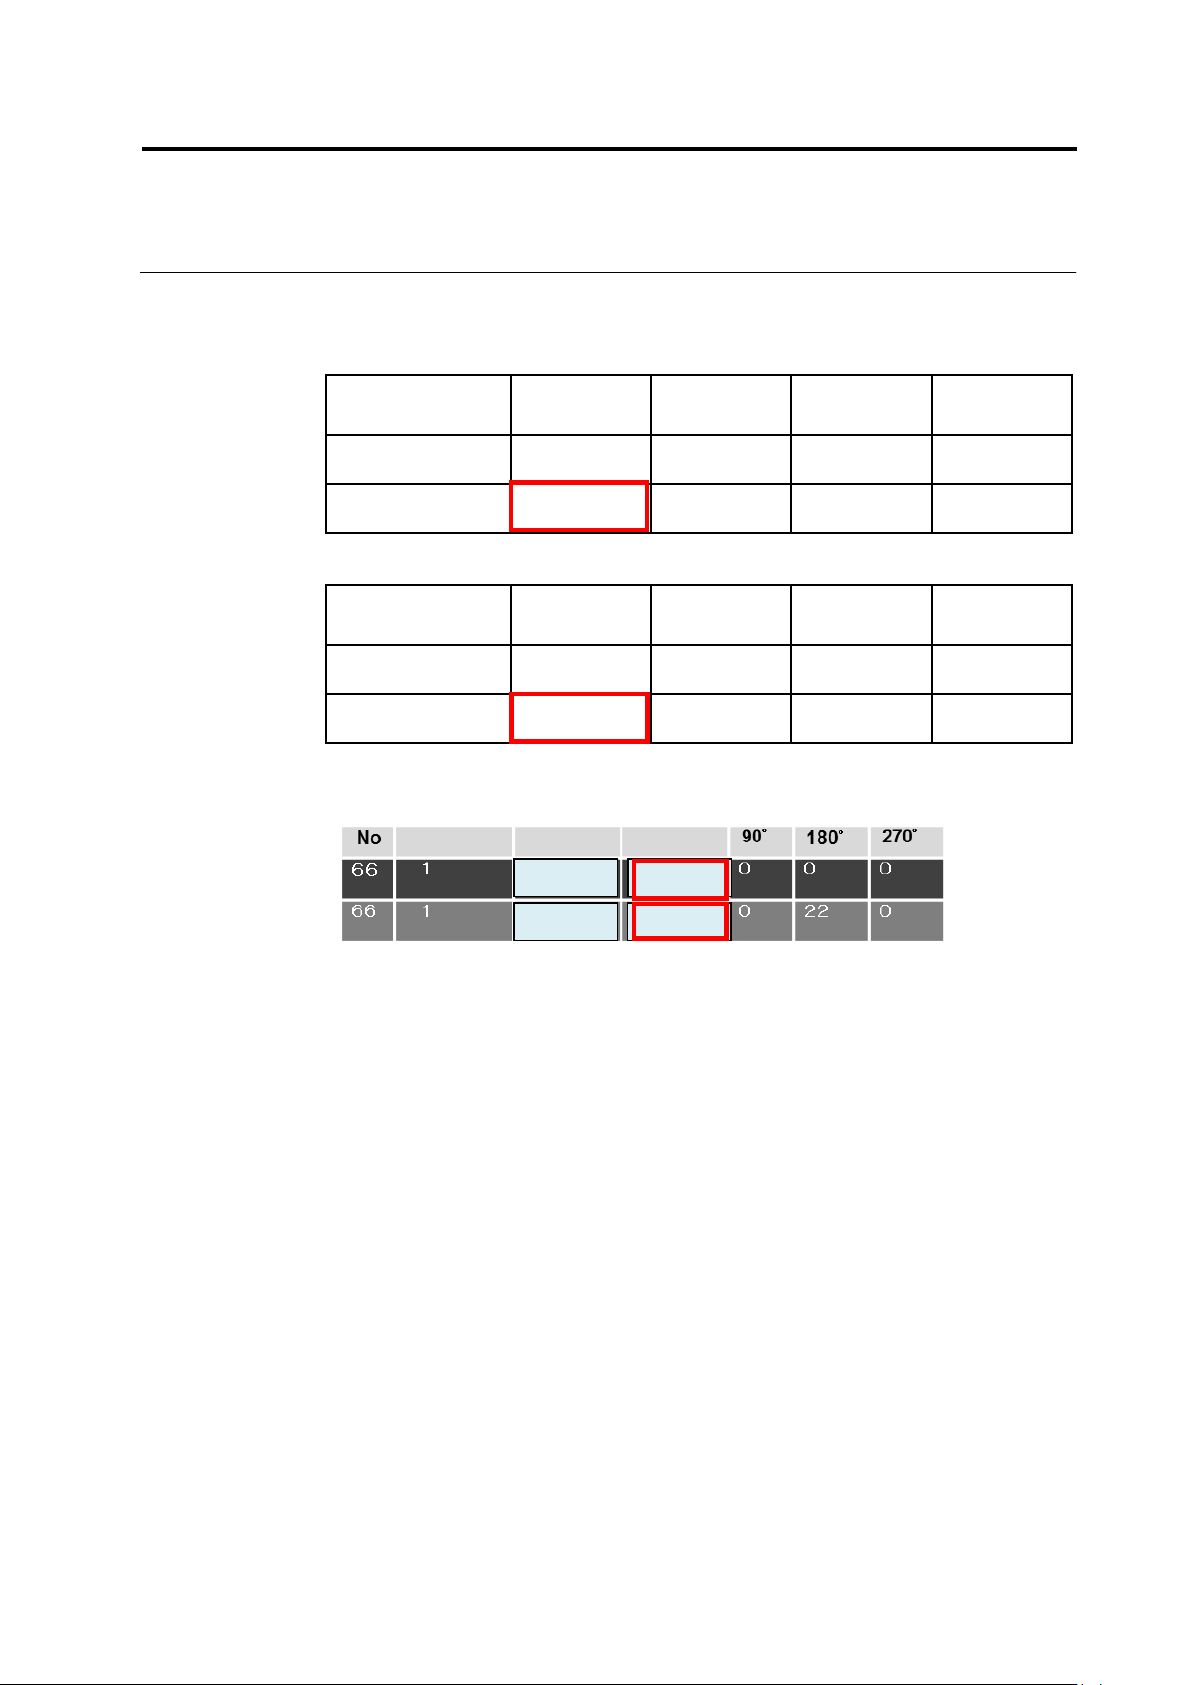
Measured values are calculated internally, and the ones of wrong polarity (enclosed
with red frames) are displayed.
Measured values of model 1
Wrong
polarity (0°)
90°
180°
270°
Matching rate (ex.)
85
39
71
45
Measured value
85 – 71 = 14
39 – 85 = -46
71 – 85 = -14
45 – 85 = -40
Measured value of model 2
Wrong
polarity (0°)
90°
180°
270°
Matching rate (ex.)
60
62
84
50
Measured value
60 – 84 = -24
62 – 84 = -22
84 – 62 = 22
50 – 84 = -34
The measured values inside the red frames are displayed according to the
calculation result from the above internal processing.
Out of models 1 and 2, model 1 which has a larger measured value (14) is adopted.
As a result, model 1 is judged as OK if the measured value of 0° (14) is within the
range of the settings of the inspection criteria.
85
84
14
-24
Group No
Wrong Compo.
Wrong Polarity