MR8740、MR8741_user_manual_eng_20191016H.pdf - 第131页
119 5 Chapter 6 W aveform Screen Monitoring and Analysis 6 Analytical operations such as display magnification, compression, and sea rch are available on the Waveform screen. W aveform Screen Monitoring and Analysis Cha …

5.5 Miscellaneous Printing Functions
118
119
5
Chapter 6 Waveform Screen Monitoring and Analysis
6
Analytical operations such as display magnification, compression, and search are available on the
Waveform screen.
Waveform Screen Monitoring
and Analysis Chapter 6
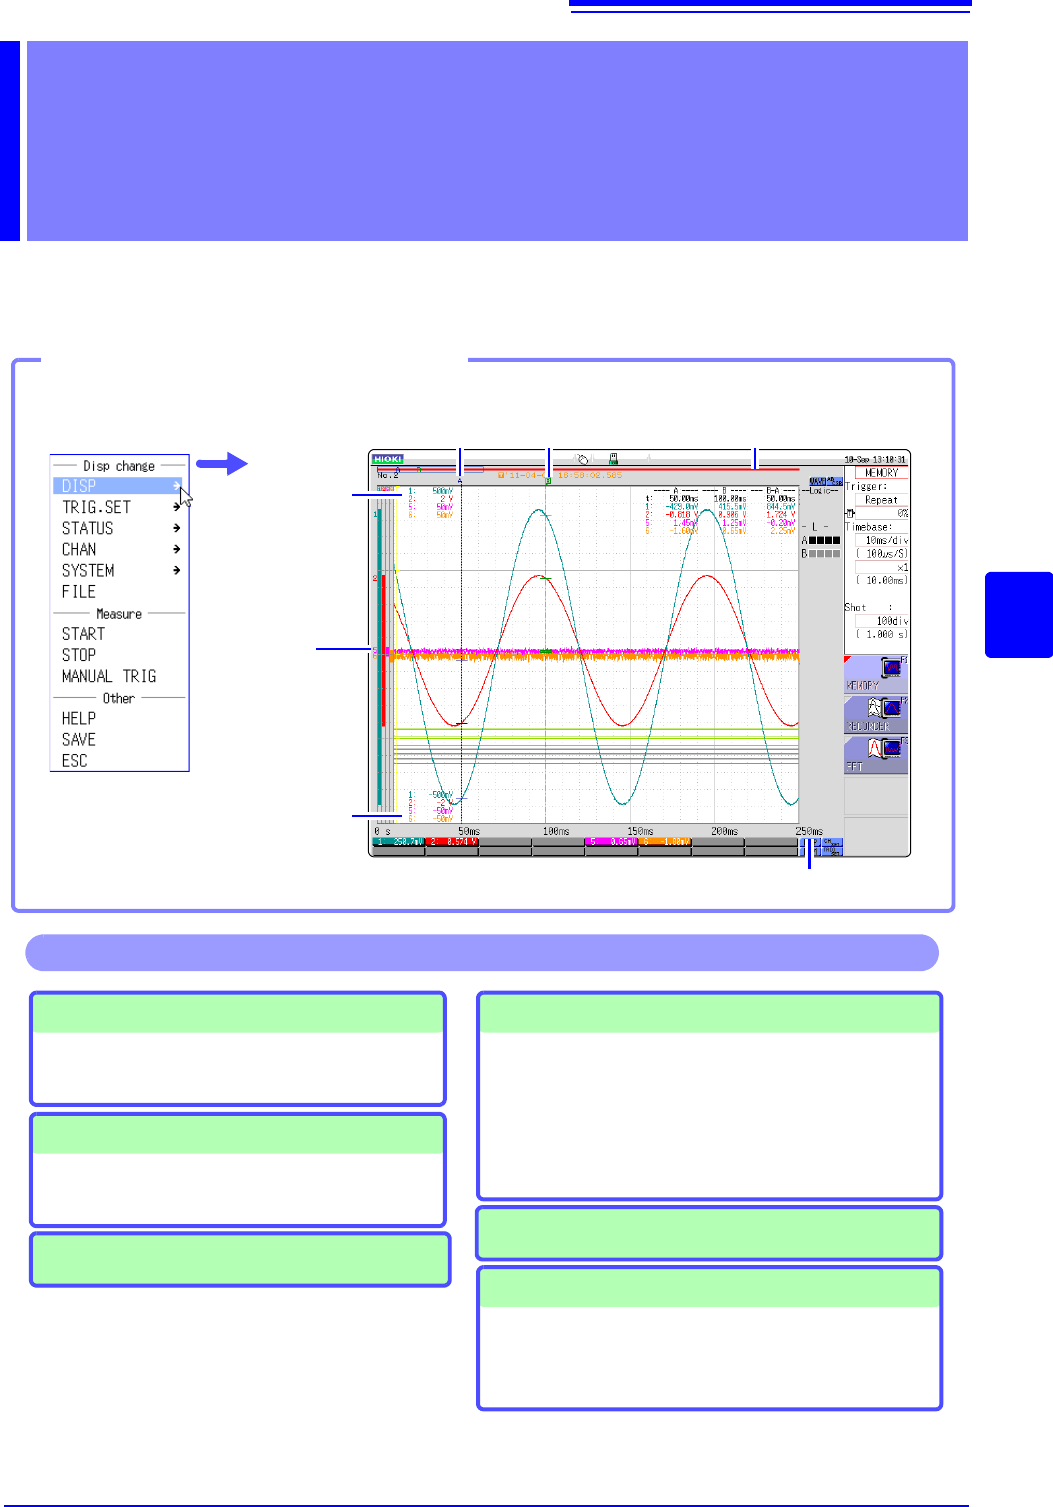
A cursor
(p.120)
B cursor
(p.120)
Level Monitor
(p.132)
Time Value (p.310)
Upper Limit Value
(p.134)
Lower Limit Value
(p.134)
Scroll bar
(p.125)
Opening the Waveform screen
Click [DISP] in the right-click menu.
Performing X-Y Synthesis (p.127)
A/B Cursor
• Read measurement value (p.120)
• Specifying a Waveform Range (p.124)
Operations available from the Waveform screen
Monitoring Input Levels (p.132)
Switching the Waveform Screen (p.134)
• Displaying upper and lower limit values
• Displaying comments
• Switching the waveform display width
Moving the Waveform Display Position
• Moving the waveform (p.125)
• Moving the position (p.126)
Magnifying and Compressing Waveforms
• Magnifying and Compressing Horizontal Axis
(Time Axis) (p.129)
• Zoom Function (Magnifying a Section of the
Horizontal Axis (Time Axis) )(p.130)
• Magnifying and Compressing Vertical Axis
(Voltage Axis) (p.131)
6.1 Reading Measurement Values (Using the A/B Cursors)
120
• Time difference, frequency and potential difference (and when scaling is enabled, scaling values)
can be read as numerical values using the A/B cursors on the Waveform screen. The cursors also
allow specifying the calculation and X-Y synthesis range.
• When displaying the X-Y waveform, the A/B cursors can be used to read the measurement val-
ues. Also with a split screen, A/B cursors can be used separately in the graphs to read the poten-
tial difference between the A and B points.
6.1 Reading Measurement Values (Using the A/
B Cursors)
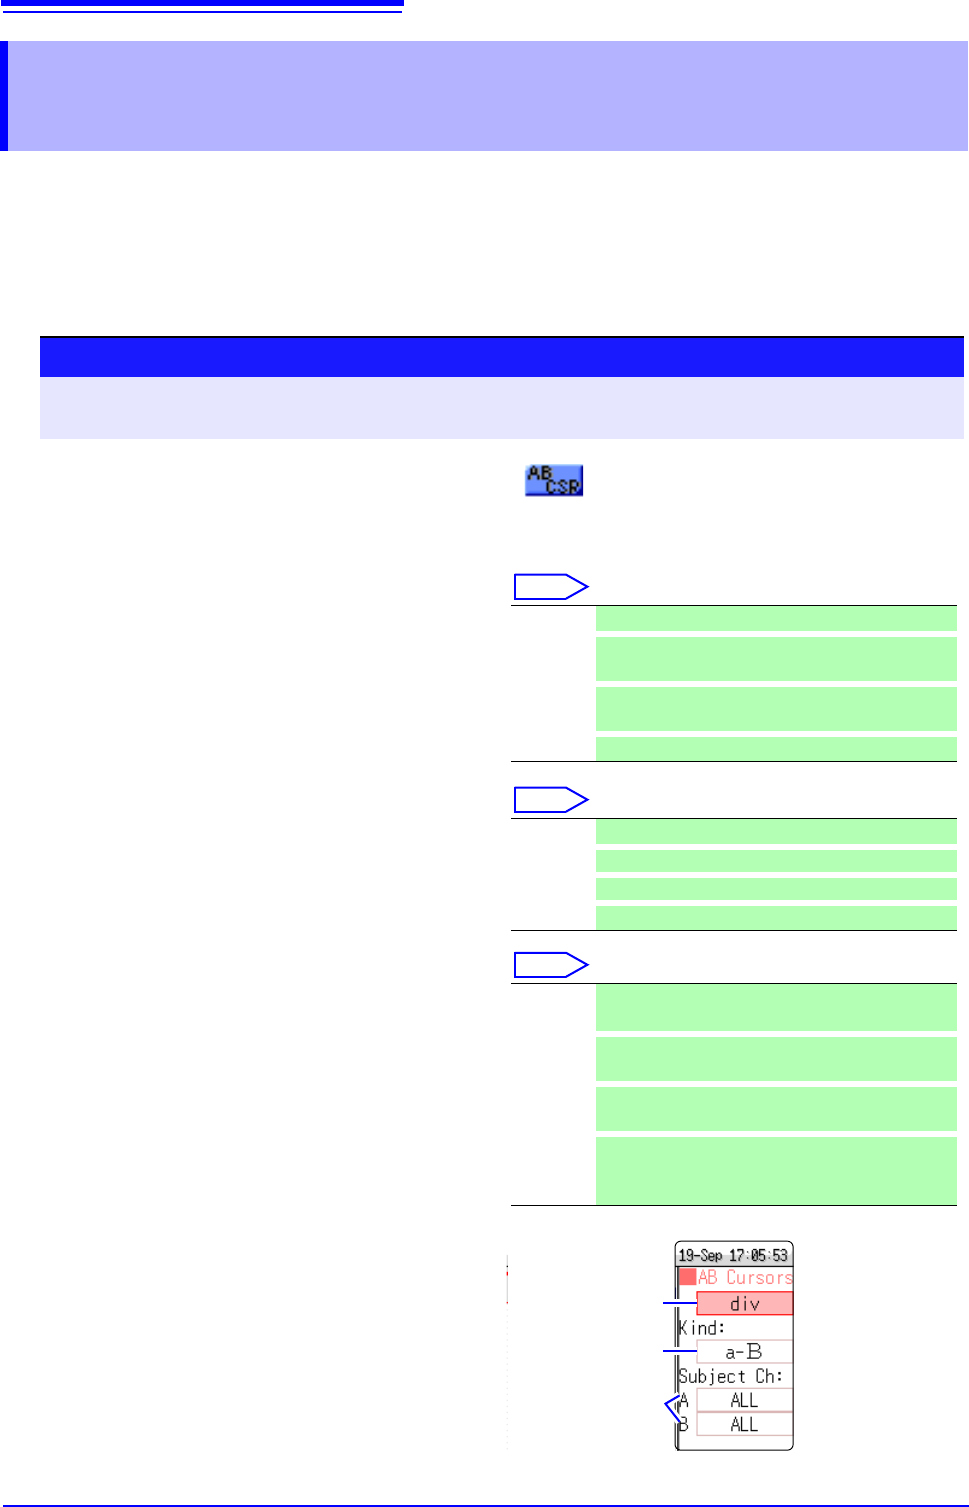
A/B Cursor Settings
To open the screen: Right-click and select [DISP] Waveform screen Left-click [AB CSR] A/B cursors
settings window
1
Left-click the [AB CSR] icon.
Left-click the [AB CSR] icon on the top right of
the Waveform screen.
2
Select the Cursor Type.
Select
Move the flashing cursor to the [A/B Cursosrs]
item and select it.
3
Select the movement target for the A/B
cursors
Select
Move the flashing cursor to the [Kind] item and
select it.
4
Select the measurement target channel
([Subject CH]) for A and B
Select
Move the flashing cursor to the [A] or [B] item
and select it.
5
Move the A/B cursors
If you click while the mouse cursor is in the
Waveform screen, the A/B cursors move to that
position. Furthermore, you can also move the A
or B cursor by dragging the A or B cursor mark
on the Waveform screen while holding down the
left button of the mouse.
Off A/B cursors are not used.
div
Move in horizontal axis (time axis) direction (X
axis for X-Y synthesis)
Range
Move in vertical axis (voltage axis) direction (Y
axis for X-Y synthesis)
Trace
Trace waveform data.
A Use only cursor A.
A-b
Use A/B cursors but move only cursor A.
a-B
Use A/B cursors but move only cursor B.
A&B
Move both cursor A and cursor B together.
ALL Shows measurement values for all channels.
(When cursor type is [Trace] or [Range])
Ch1 to
Ch16
Show measurement values in selected channels
out of Ch1 - Ch16 (for 1, 2, 4, 8, 16 screens).
Gr1 to
Gr8
Specify X-Y synthesis for Gr1 to Gr8 (for X-Y
screen)
Analog
ChCalc
Ch
When there is data on which waveform calculation
has been performed, the cursor target is switched
by analog channel and waveform calculation data.
1
2
3