MR8740、MR8741_user_manual_eng_20191016H.pdf - 第136页
6.2 Specifying a Waveform Range (A/B Cursor) 124 When the waveform is shown as a time display, the range can be specified with the div curso r or Trace cursor. The specified range will be used for file saving, X- Y synth…
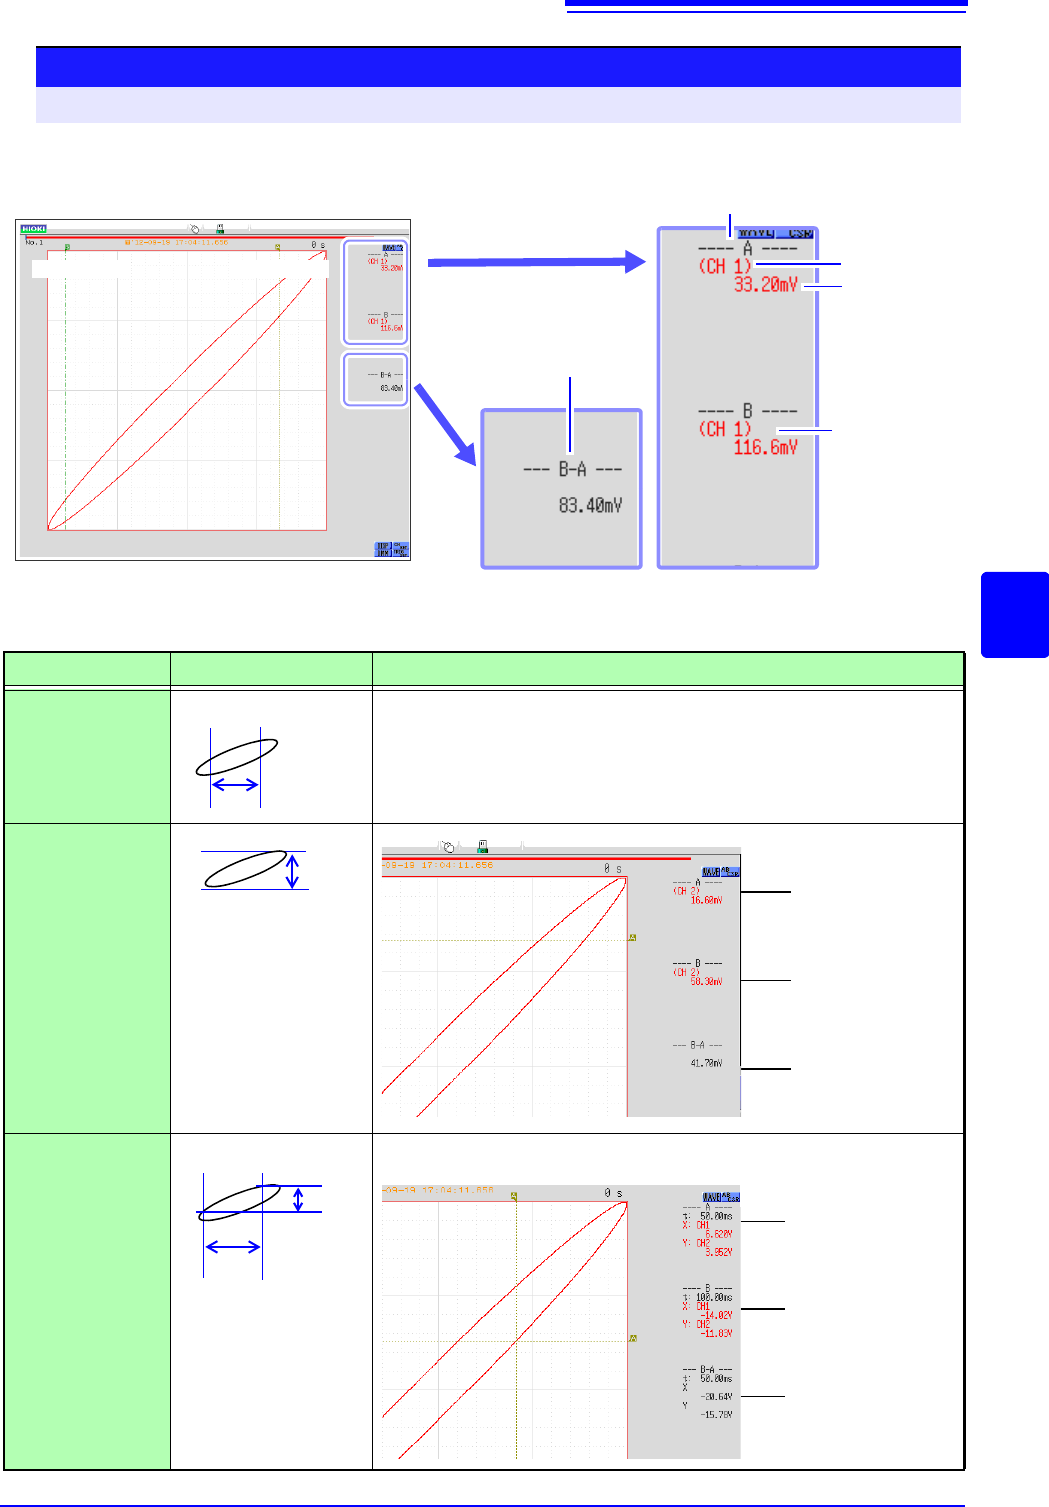
6.1 Reading Measurement Values (Using the A/B Cursors)
123
5
Chapter 6 Waveform Screen Monitoring and Analysis
6
<Screen display (X axis measurement value)>
Reading Measurement Values on Waveform Screen (for X-Y1, 4 screens)
To open the screen: Right-click and select [DISP] Waveform screen
B Cursor A Cursor
X-Y synthesis of channel 1 and channel 2 waveform
Channel
Measure-
ment Value
Cursor A Value
Cursor B
Value
Difference between
measured values at
A/B cursors
<Cursor Value>
Cursor Type
Cursor Value
Cursor Value Display Example (with two cursors)
X
(X axis measure-
ment value)
See "Screen display" above
Y
(Y axis measure-
ment value)
Trace
(Time and X axis,
Y axis measure-
ment value)
AB
B-A
A
B
B-A
Cursor A
measurement
value
Cursor B
measurement
value
Difference
between mea-
sured values at
A/B cursors
(Y axis channels)
A
B
B-A
B-A
(Y axis)
(X axis)
Cursor A time and
measurement value
Cursor B time and
measurement value
Time and measure-
ment value differen-
tial between cursor
A and B
(X axis and Y axis channels)
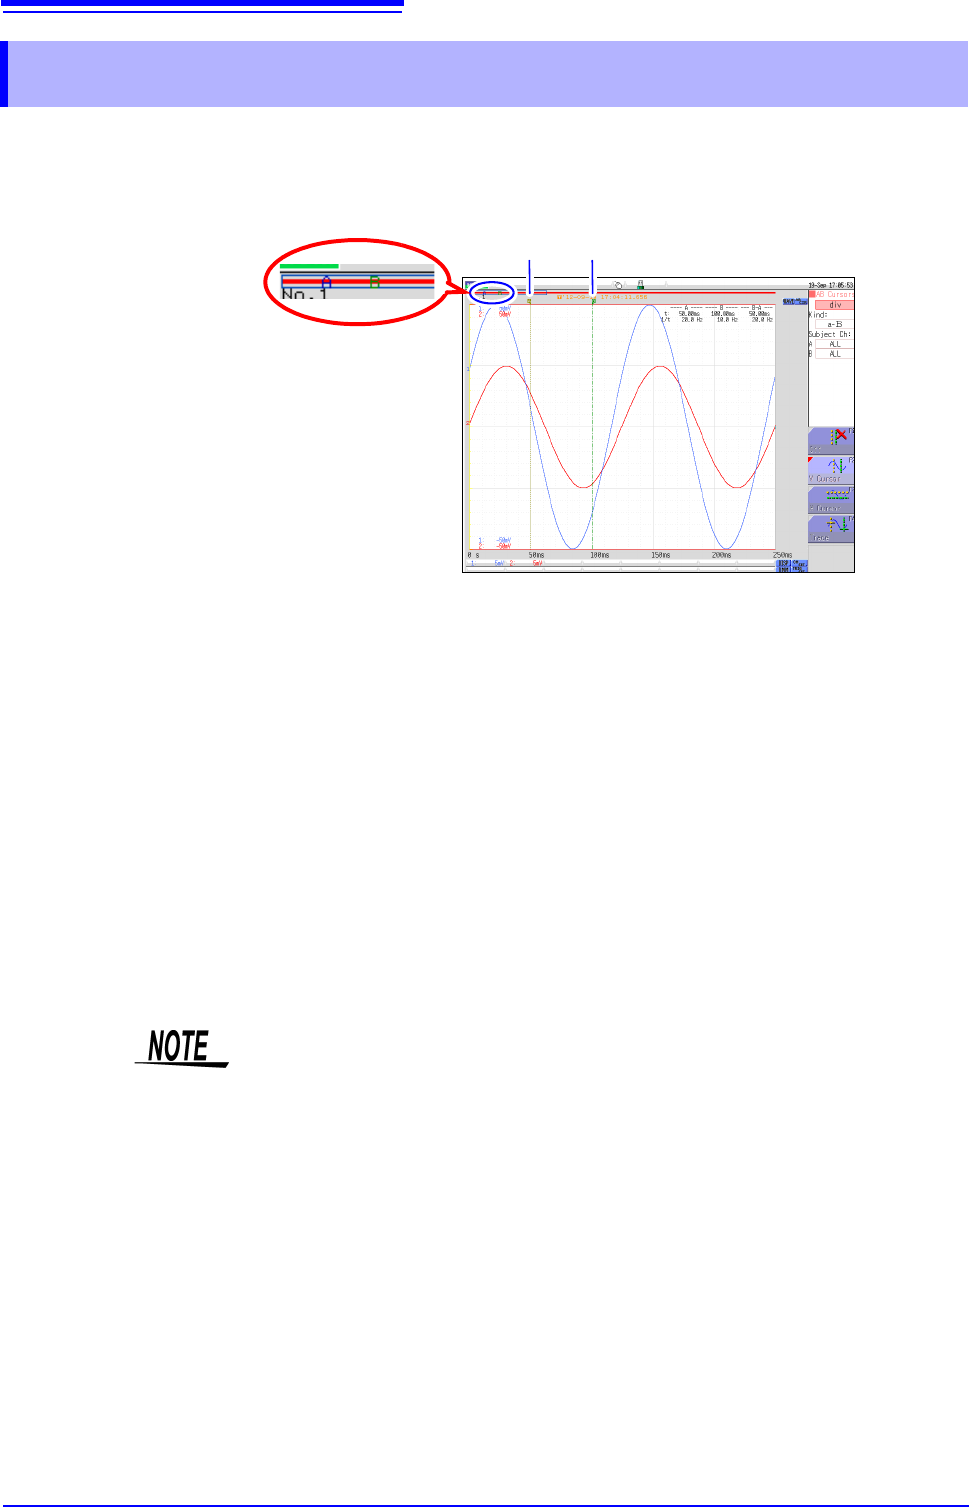
6.2 Specifying a Waveform Range (A/B Cursor)
124
When the waveform is shown as a time display, the range can be specified with the div cursor or
Trace cursor.
The specified range will be used for file saving, X-Y synthesis, and numerical calculation. The range
selection will be retained also when the waveform display format is changed.
The general procedure is as follows.
1. Set A/B cursors
See: "A/B Cursor Settings" (p. 120)
2. Specify a range
• For file saving:
System screen - [File Save] sheet - [Save Area] item: Select [A-B Wave].
See:"4.2.2 Automatically Saving Waveforms" (p.88)
"4.2.3 Saving Data Selectively (SAVE)" (p.93)
• For X-Y synthesis:
Status screen - [Status] sheet - [Combo Area] item: Select [A-B Wave].
See:"6.4 Performing Waveform X-Y Synthesis" (p.127)
• For numerical calculation:
Status screen - [Num Calc] sheet - [Calc Area] item: Select [A-B Wave].
See:"9.2 Settings for Numerical Value Calculation" (p.214)
6.2 Specifying a Waveform Range (A/B Cursor)
Cursor position can be
verified.
A Cursor B Cursor
About reading measurement values and cursor types:
See: "6.1 Reading Measurement Values (Using the A/B Cursors)" (p.120)
Available range for A/B cursor
The available range depends on the function.
• Memory function: Recorded measurement data for one measurement
• Recorder function: Up to the range of measurement data recorded during one mea-
surement, or up to the range of measurement data that can be recorded internally,
starting at the point at which measurement ended and going backwards in time.
The following measurement data can be recorded internally: max. 80,000div
When the MR8990 Digital Voltmeter Unit is installed
There may be one data item more than the range (number of data items) speci-
fied with the A/B cursors.
6.3 Moving the Waveform Display Position
125
5
Chapter 6 Waveform Screen Monitoring and Analysis
6
This applies to the Memory function and Recorder Function.
From the scroll bar you can verify the relative position and size of the displayed portion of a wave-
form within the overall recorded waveform.
Trigger time, trigger position and A/B cursor positions (when using voltage axis cursor or trace cur-
sors) are also displayed.
When measuring or displaying an existing waveform, use the mouse to scroll.
6.3 Moving the Waveform Display
Position
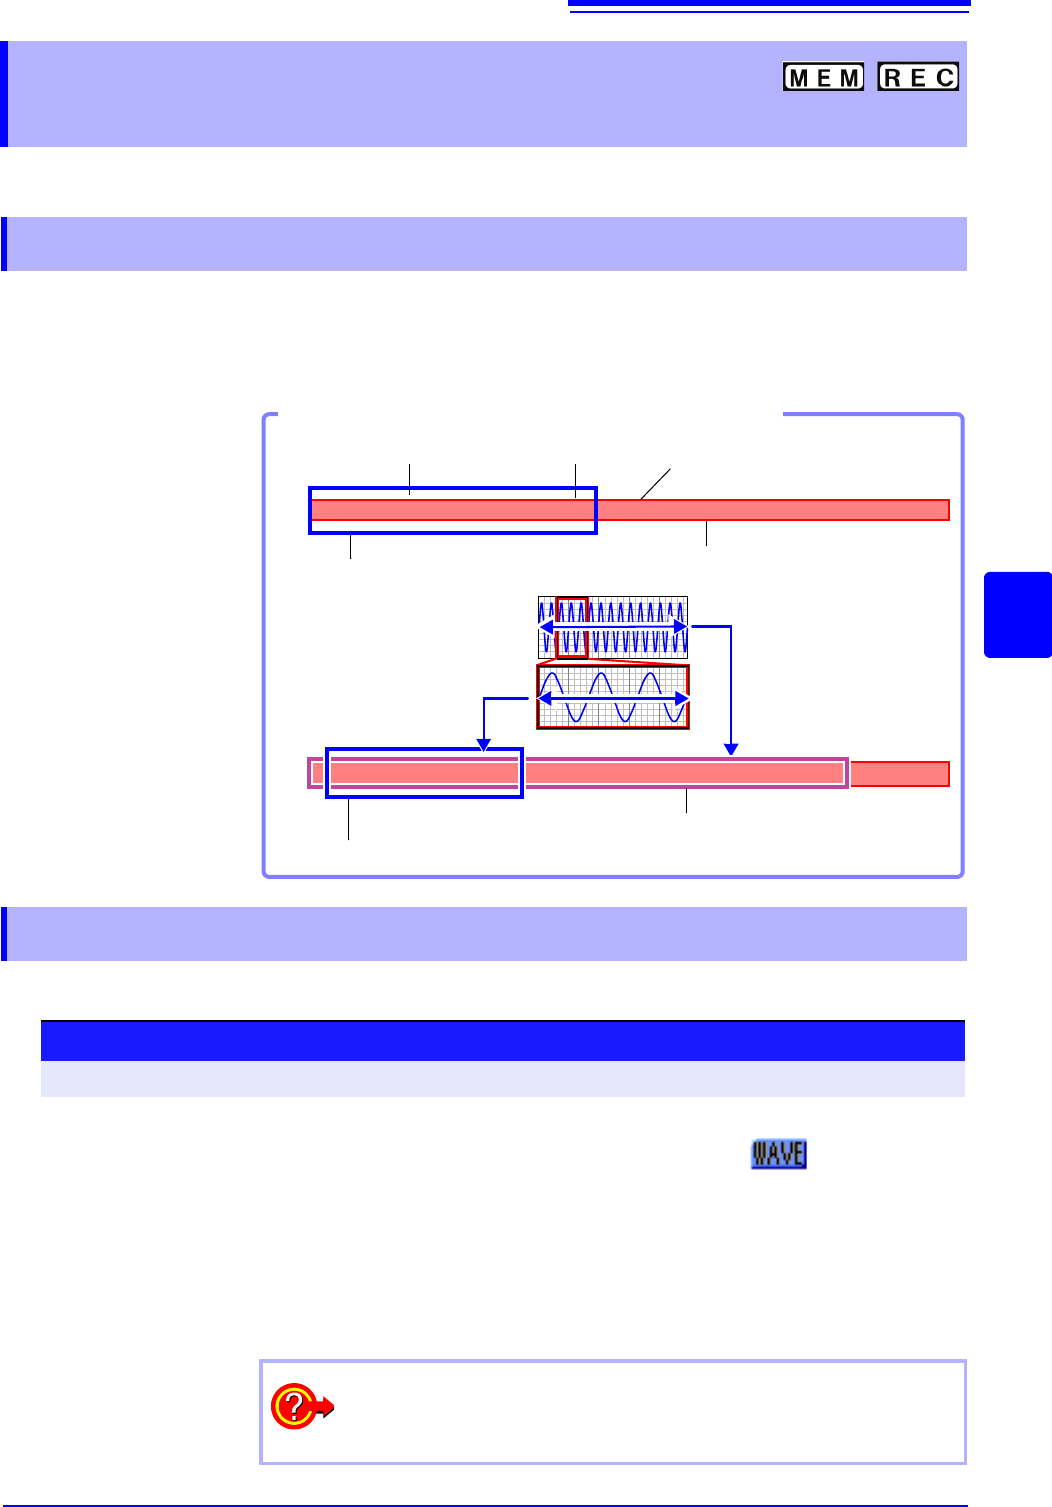
6.3.1 About Display Position
Verifying the Display Range on the Scroll Bar
Trigger Point
A Cursor
B Cursor
T
A
B
Blue frame: Screen display range (25 div)
With zoomed display
(p.130)
Blue frame: Zoomed display range (lower waveform)
Pink frame: Display range (upper waveform)
Red bar: Recorded waveform
(Gray bar if waveform
is within recording
length)
6.3.2 Scrolling the Measurement Waveform
Scrolling measured waveforms left or right
To open the screen: Left-click the [WAVE] icon.
1
Left-click the [WAVE] icon.
Left-click the [WAVE] icon on the top right of the Waveform screen.
2
Move the mouse left or right while holding down the left mouse button
(dragging) when the mouse cursor is in the Waveform screen.
The waveform is scrolled.
You can rotate the wheel button forward or backward to make fine scrolling adjustments.
To see past waveforms in Roll Mode
You can view past waveforms during measurement by scrolling the
waveforms with the mouse. To redisplay a waveform, select [Scroll].