MR8740、MR8741_user_manual_eng_20191016H.pdf - 第79页
3.4 Setting Measurement Configuration 67 3 Chapter 3 Measuremen t Procedure The timebase setting establishes the rate of inpu t signal wavefo rm acquisition, specified as time- per-division on the horizontal a xis (time/…
3.4 Setting Measurement Configuration
66
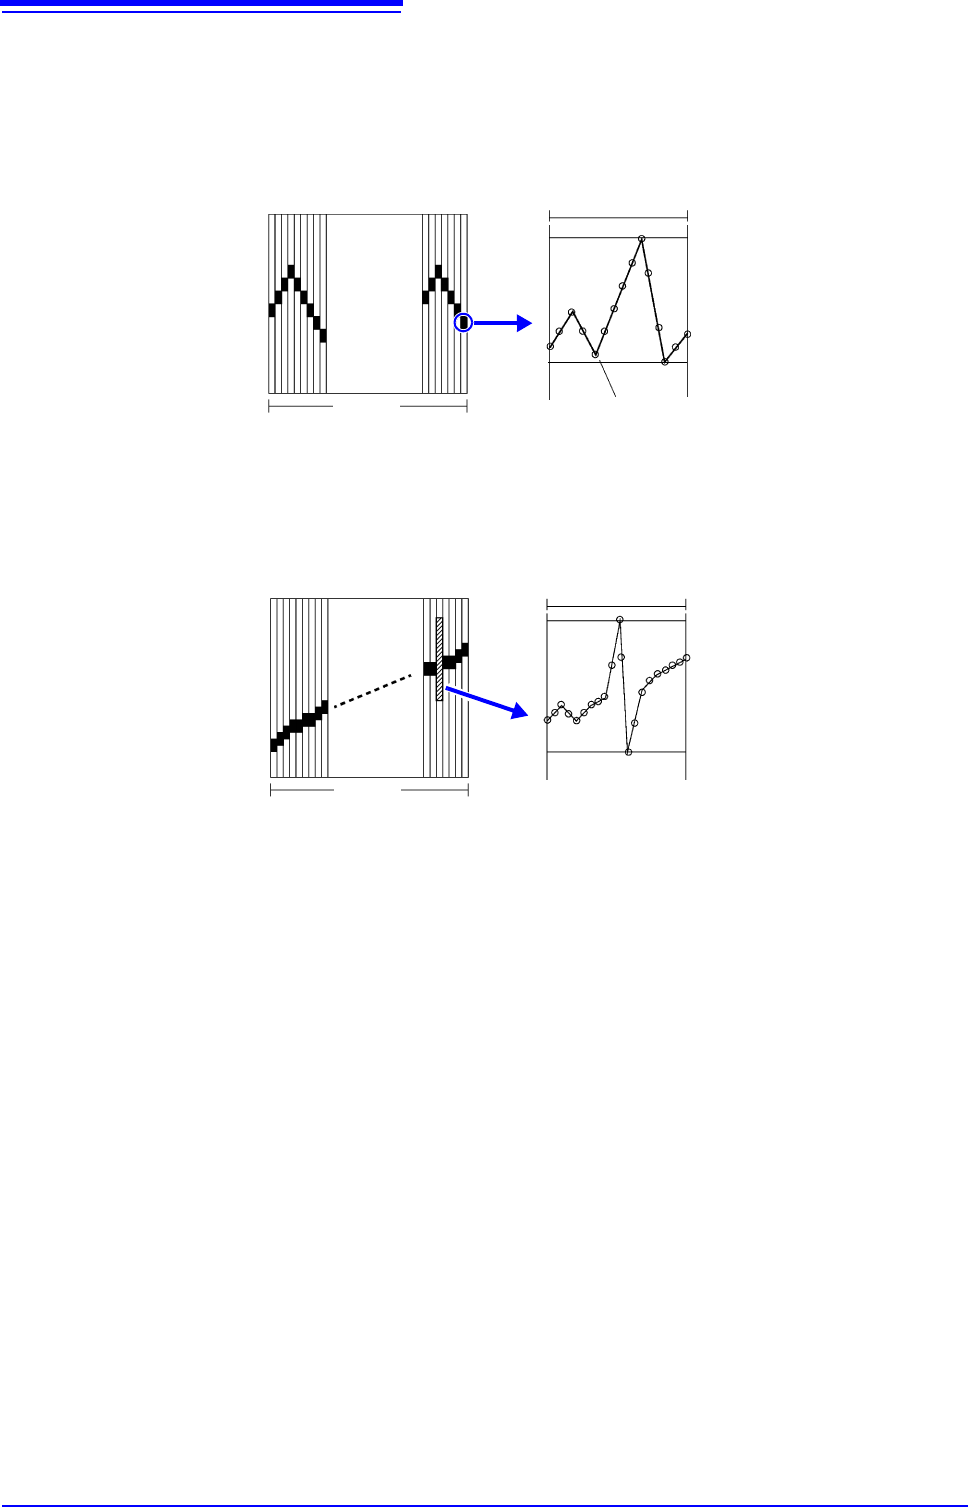
Description Recorder Function Values
With the Recorder function, each data sample consists of the maximum and min-
imum values acquired in the specified sampling period. So each data sample
has its own amplitude breadth.
When input waveform variation is slight, the difference between maximum and
minimum values (breadth, or width) can be inordinately large if the sampling
period is short and if severe fluctuations are present due to noise.
This phenomena may be prevented by setting a longer sampling period.
1 2 3 4........... ....100
1 div
Data of One Sample
Maximum value
Minimum value
Data acquired within the specified sampling period
1 2 3 4........... ....100
1 div
Data of One Sample
Maximum value
Minimum value
When the sampling period is short (fast)
3.4 Setting Measurement Configuration
67
3
Chapter 3 Measurement Procedure
The timebase setting establishes the rate of input signal waveform acquisition, specified as time-
per-division on the horizontal axis (time/div).
The sampling setting specifies the interval from one sample to the next.
(The setting is shown in brackets under the time axis range for the Memory function (see illustration at
right). The indication changes with the time axis range.)
3.4.2 Time Axis Range and Sampling
Rate
Procedure
To open the screen: Right-click and select [DISP] Waveform screen
Memory Function case
1
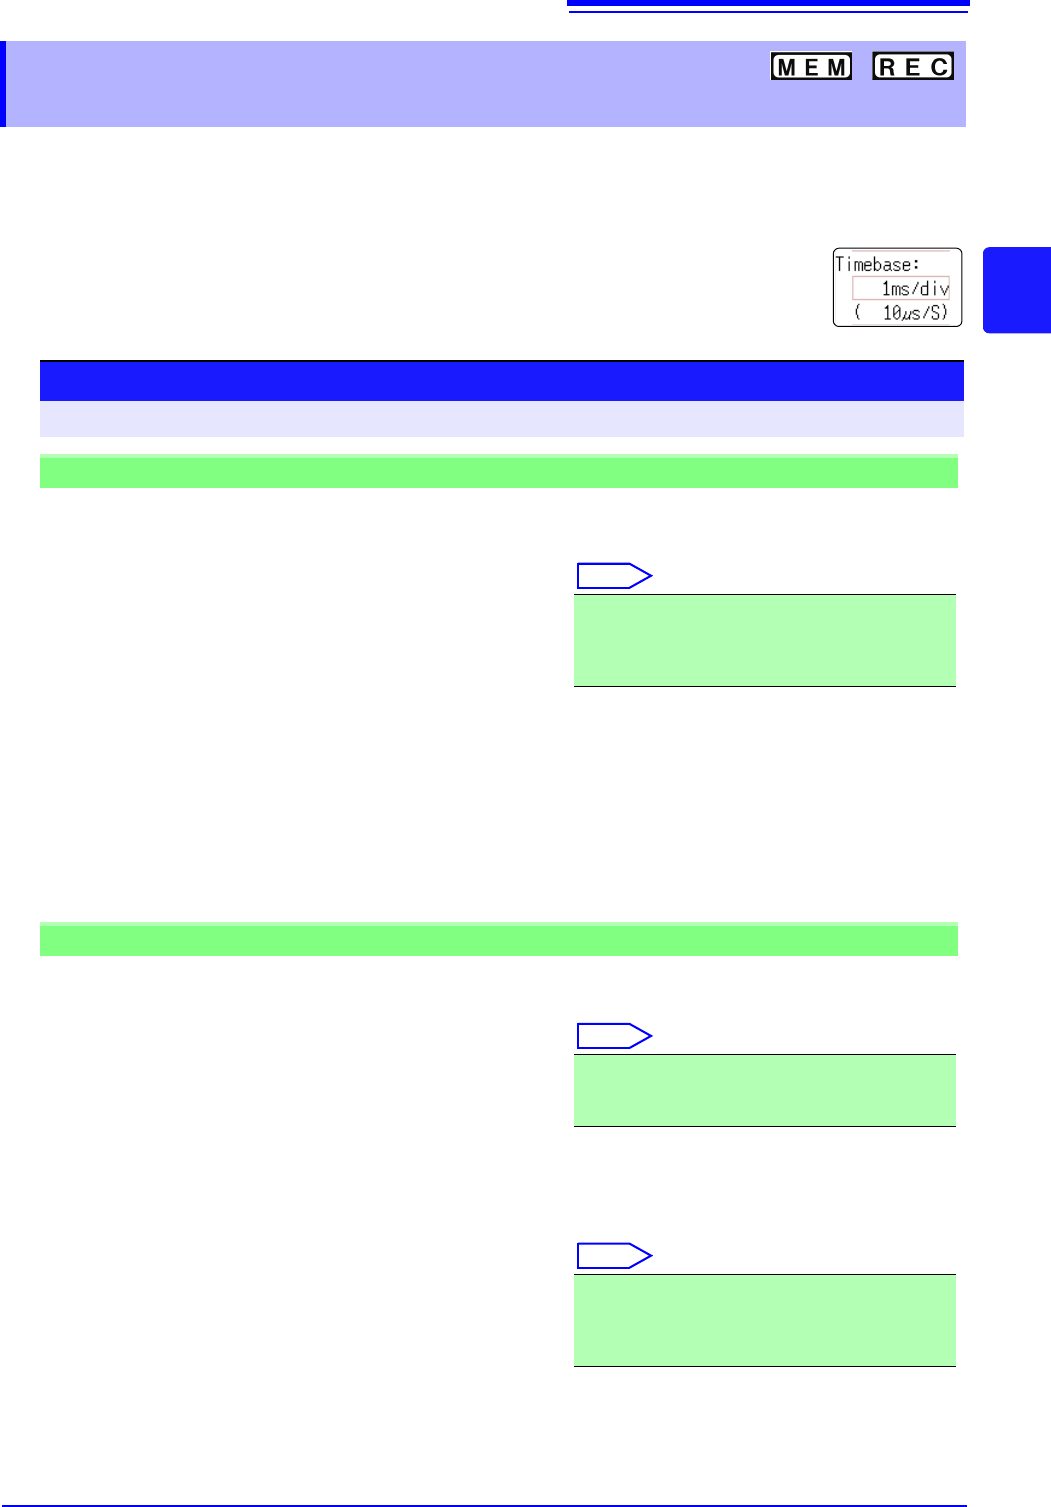
Move the flashing cursor to the [Timebase] item,
and then left-click.
2
Set the time per division (timebase) on the hori-
zontal axis.
Select
To control sampling by an external signal, select [External]. (MR8741 only)
When external sampling is selected, the number of samples per division can be set in the range from 10
- 10000 S/div.
See: "16.2.3 External Sampling (SMPL)" (p.340)
5 (default setting), 10, 20, 50, 100, 200, 500 s/div
1, 2, 5, 10, 20, 50, 100, 200, 500 ms/div
1, 2, 5, 10, 30, 50 s/div, 1 min/div, 100 s/div
2, 5 min/div
Recorder Function case
1
Move the flashing cursor to the [Timebase] item.
2
Set the time per division (timebase) on the hori-
zontal axis.
Select
3
Move the flashing cursor to the [Sampling] item.
4
Set the sampling rate.
Select
The range of choices depends on the selected timebase.
The higher the sampling rate, the more detailed changes can be observed.
10 (default setting), 20, 50, 100, 200, 500 ms/div
1, 2, 5, 10, 30, 50 s/div, 1 min/div, 100 s/div
2, 5, 10, 30 min/div, 1 h/div
1 (default setting), 10, 100 s
1, 10, 100 ms
(Select a sampling rate less than 1/100 of the time
axis)
3.4 Setting Measurement Configuration
68
Description
Selecting the
time axis range
Refer to the table below when setting the time axis range.
For example, to measure a 100 kHz waveform, the maximum display frequency set-
ting range according to the table is 200 kHz - 800 kHz. If the maximum display fre-
quency is set to 400 kHz, setting the time axis range to 10 s/div is recommended.
Timebase Sampling Rate (Speed) Maximum display frequency
5 s/div
10 s/div
20 s/div
50 s/div
100 s/div
200 s/div
500 s/div
1 ms/div
2 ms/div
5 ms/div
10 ms/div
20 ms/div
50 ms/div
100 ms/div
200 ms/div
500 ms/div
1 s/div
2 s/div
5 s/div
10 s/div
30 s/div
50 s/div
1 min/div
100 s/div
2 min/div
5 min/div
50 ns (20 MS/s)
100 ns (10 MS/s)
200 ns (5 MS/s)
500 ns (2 MS/s)
1s (1 MS/s)
2 s (500 kS/s)
5 s (200 kS/s)
10 s (100 kS/s)
20 s (50 kS/s)
50 s (20 kS/s)
100 s (10 kS/s)
200 s (5 kS/s)
500 s (2 kS/s)
1 ms (1 kS/s)
2 ms (500 S/s)
5 ms (200 S/s)
10 ms (100 S/s)
20 ms (50 S/s)
50 ms (20 S/s)
100 ms (10 S/s)
300 ms (3.33 S/s)
500 ms (2 S/s)
600 ms (1.67 S/s)
1 s (1 S/s)
1.2 s (0.83 S/s)
3 s (0.33 S/s)
800 kHz
400 kHz
200 kHz
80 kHz
40 kHz
20 kHz
8 kHz
4 kHz
2 kHz
800 Hz
400 Hz
200 Hz
80 Hz
40 Hz
20 Hz
8 Hz
4 Hz
2 Hz
0.8 Hz
0.4 Hz
0.13 Hz
0.08 Hz
0.04 Hz
0.067 Hz
0.033 Hz
0.013 Hz
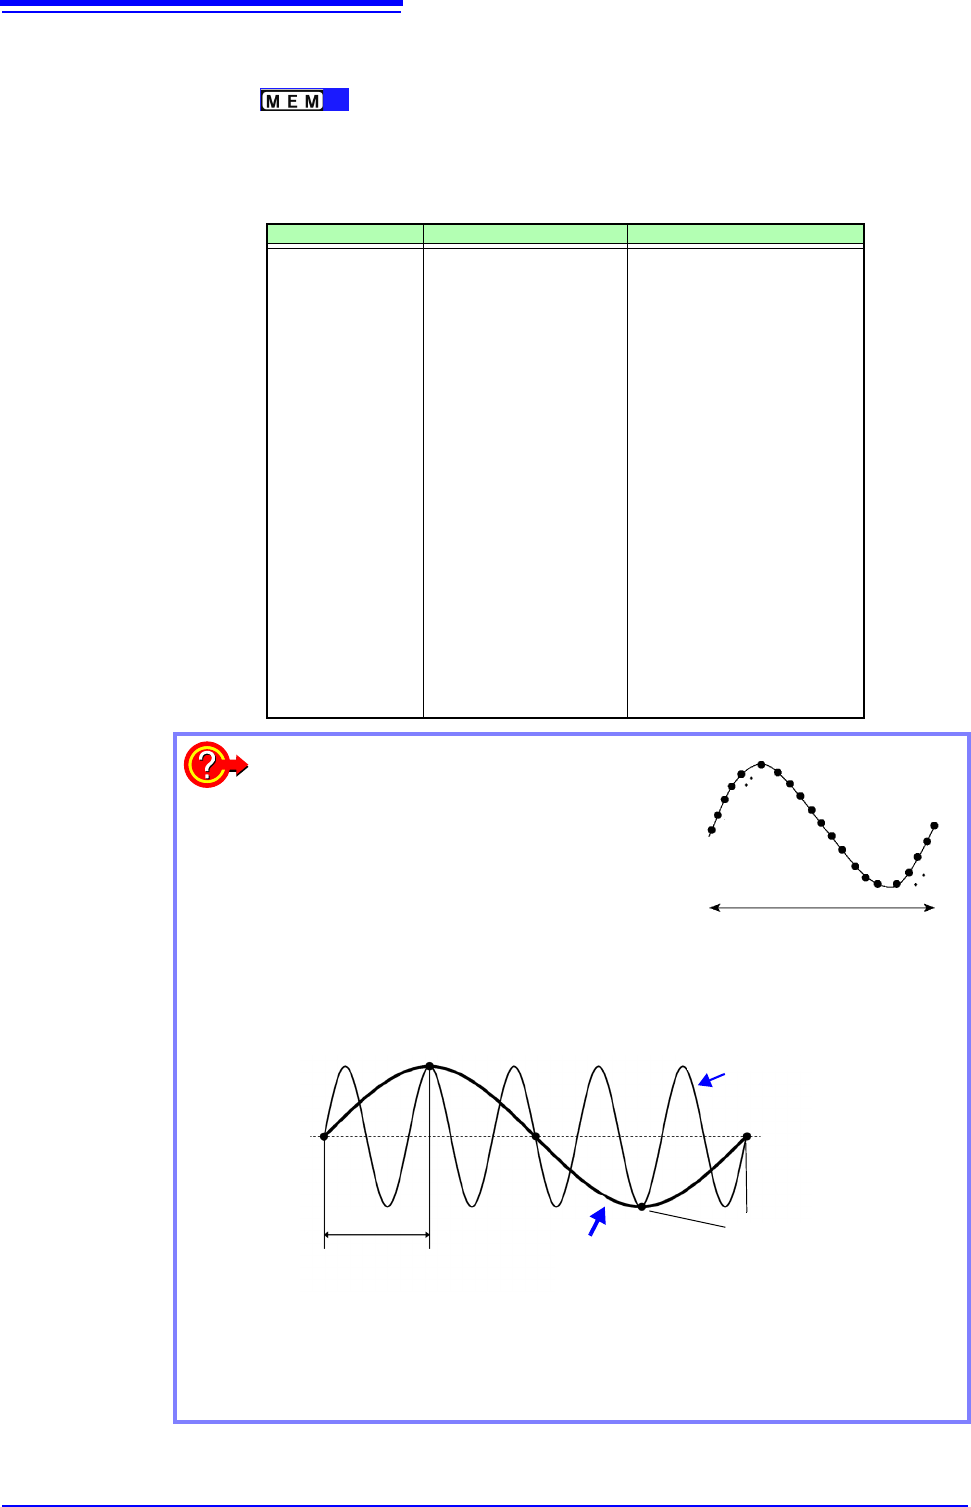
What is the maximum display frequency?
Displaying waveforms by their sampled values
with adequate resolution of characteristics such
as sine wave peaks requires a minimum of
about 25 samples per waveform period.
Maximum display frequency is determined by
the timebase.
What is aliasing (recording of non-existent waveforms)?
If the signal to be measured changes too fast relative to the sampling rate,
beginning at a certain frequency, non-existent slow signal fluctuations are
recorded. This phenomena is aliasing.
With the Memory function, the sampling rate can be significantly affected by the
timebase setting, so care is necessary to avoid aliasing when selecting the
timebase. Because the timebase determines the maximum display frequency,
the fastest possible timebase setting should be used.
One Signal Period
1
2
3
23
24
25
Sampling Rate
Measured Waveform
Aliasing occurs when the sampling period is longer
than half of the input signal period.
Actual Input Signal
Sampling Points