MR8740、MR8741_user_manual_eng_20191016H.pdf - 第283页
12.5 Setting Screen Displays 271 11 Chapter 12 FFT Function 12 Changing the grid display The display format of th e grid can be switched. Grid Type 1 1 Click [W A VE] in the right-click menu. 2 Move the flashing cursor t…
12.5 Setting Screen Displays
270
Procedure
To open the screen: Right-click and select [DISP] Waveform screen
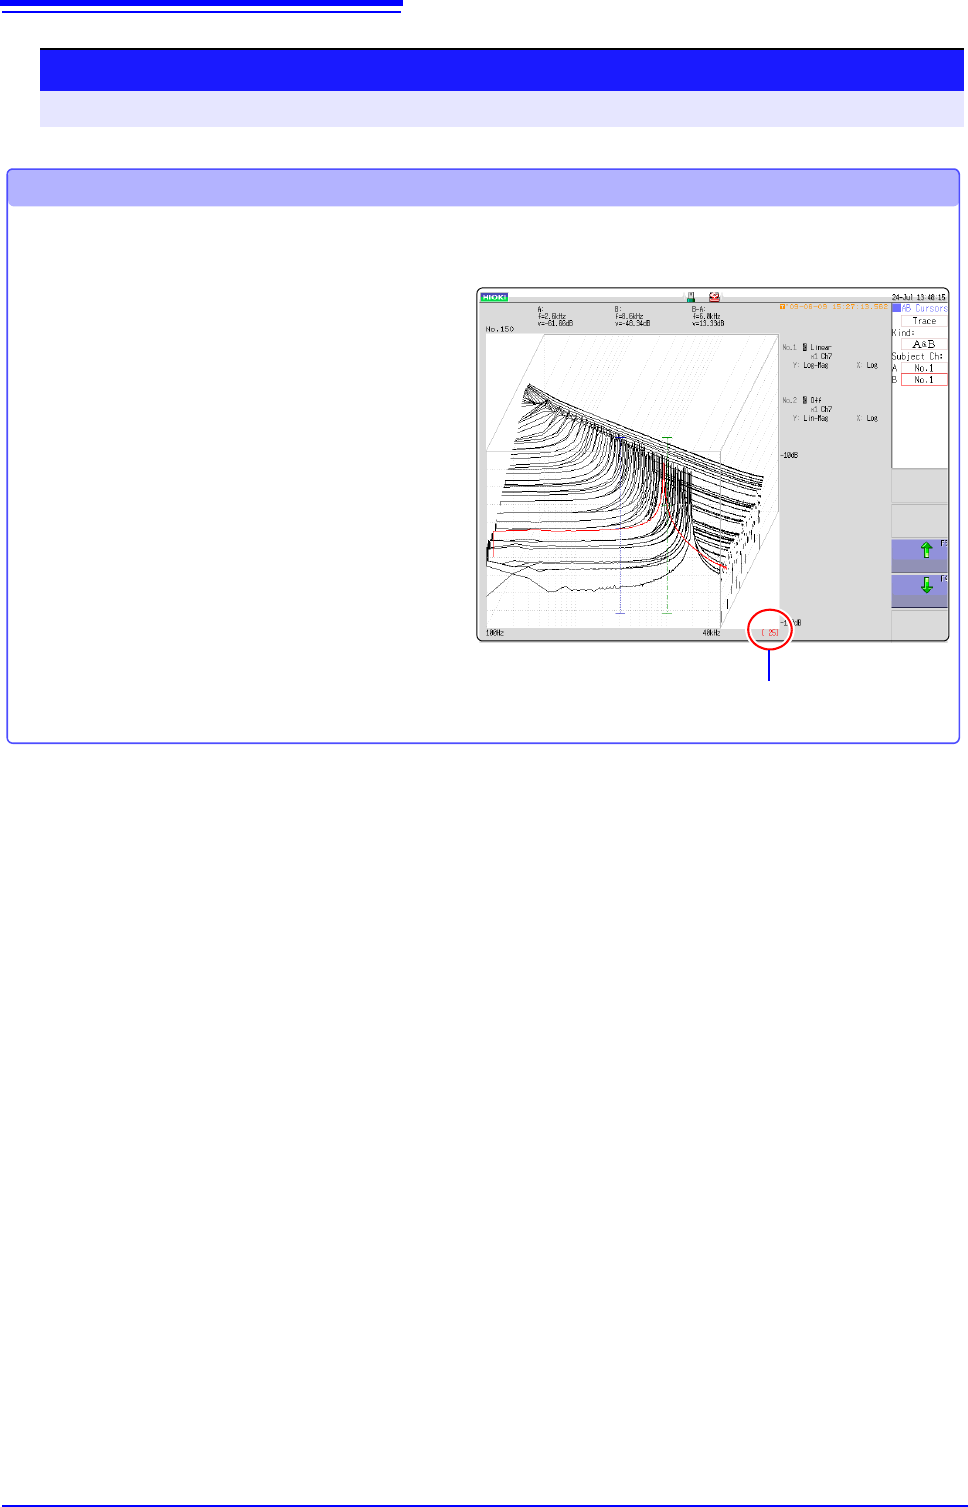
Reading measurement values of past waveforms by cursor
After measurement is finished, read the values of each waveform by cursor.
The older the waveform,
the larger the number.
1 Click [WAVE] in the right-click menu.
2 Select a waveform.
Rotate the mouse wheel to select the
waveform.
(The waveform number is displayed in the
lower right of the screen.)
3 Move the cursor.
Click [AB CSR] in the right-click menu, and
rotate the mouse wheel to read the cursor
value.
12.5 Setting Screen Displays
271
11
Chapter 12 FFT Function
12
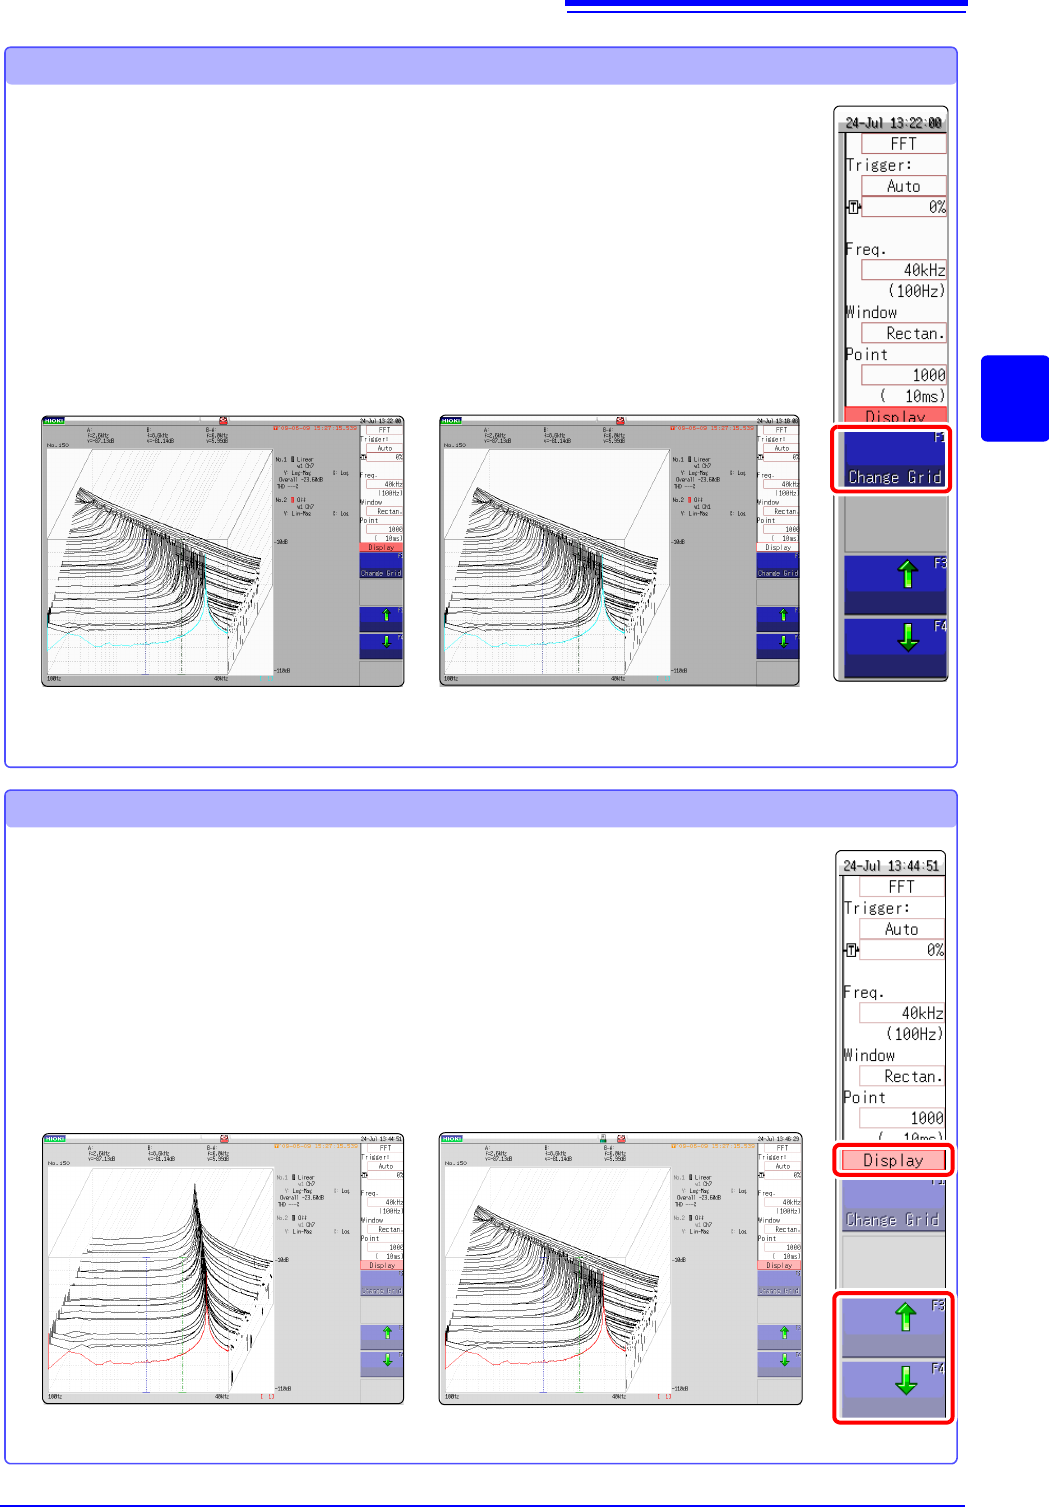
Changing the grid display
The display format of the grid can be switched.
Grid Type 1
1 Click [WAVE] in the right-click menu.
2 Move the flashing cursor to the [Display].
3 Change the grid display
Click [Change Grid] and change the grid display.
Each click changes the display format.
Grid Type 2
1 Click [WAVE] in the right-click menu.
2 Move the flashing cursor to the [Display].
3 Change the number of waveforms to be displayed.
Clicking either [] or [], adjust the number of waveforms to be
displayed.
Changing the number of waveforms to be displayed
The number of waveforms to be displayed can be changed.
The following number of waveforms can be selected: 10, 20, 50, 100, and 200.
100 waveforms displayed50 waveforms displayed
12.6 Saving Analysis Results
272
The saving procedure is the same as for the Memory function.
See: "Chapter 4 Saving/Loading Data & Managing Files" (p.83)
The size of saved files depends on the save format and analysis method.
See: "Appendix 2.1 Waveform File Sizes" (p.A2)
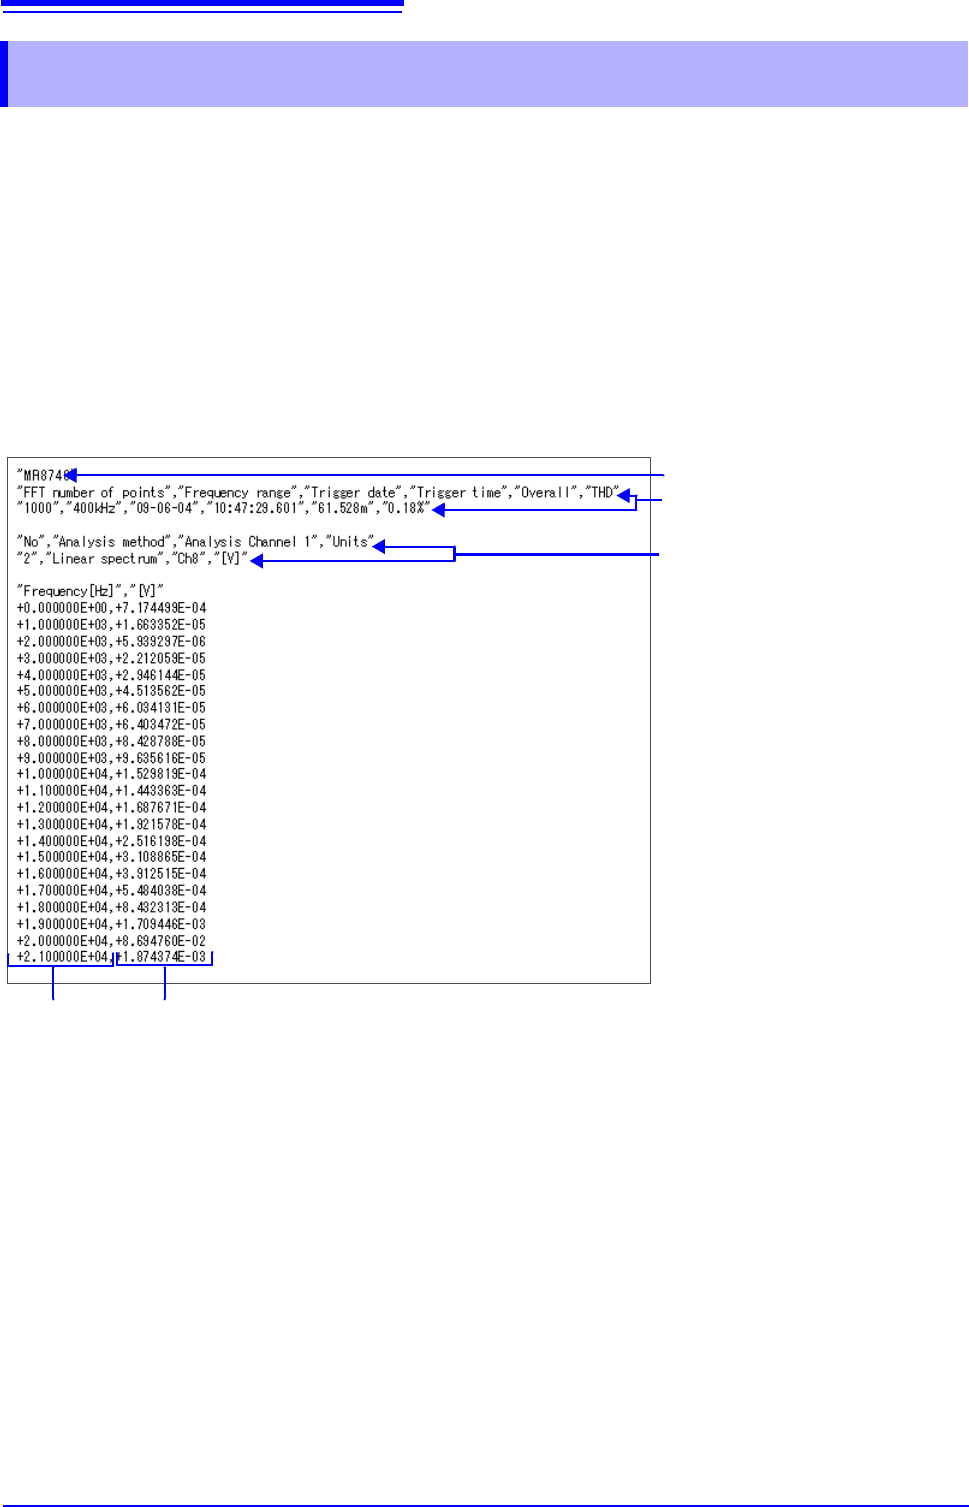
When FFT Analysis Results are Saved as Text
Divide files by calculation item and then save.
Text Saving Example
12.6 Saving Analysis Results
Line 1: Title comment
Lines 2 to 3: Trigger Time
Calculation information
X-axis data Y-axis data