MR8740、MR8741_user_manual_eng_20191016H.pdf - 第259页
12.1 Overview and Features 247 11 Chapter 12 FFT Function 12 FFT analysis can only be used with the FFT function. The FFT (Fast-Fourier Transform) functio ns provide frequency analysis of input signal dat a. Use these fu…
11.2 Display Settings
246
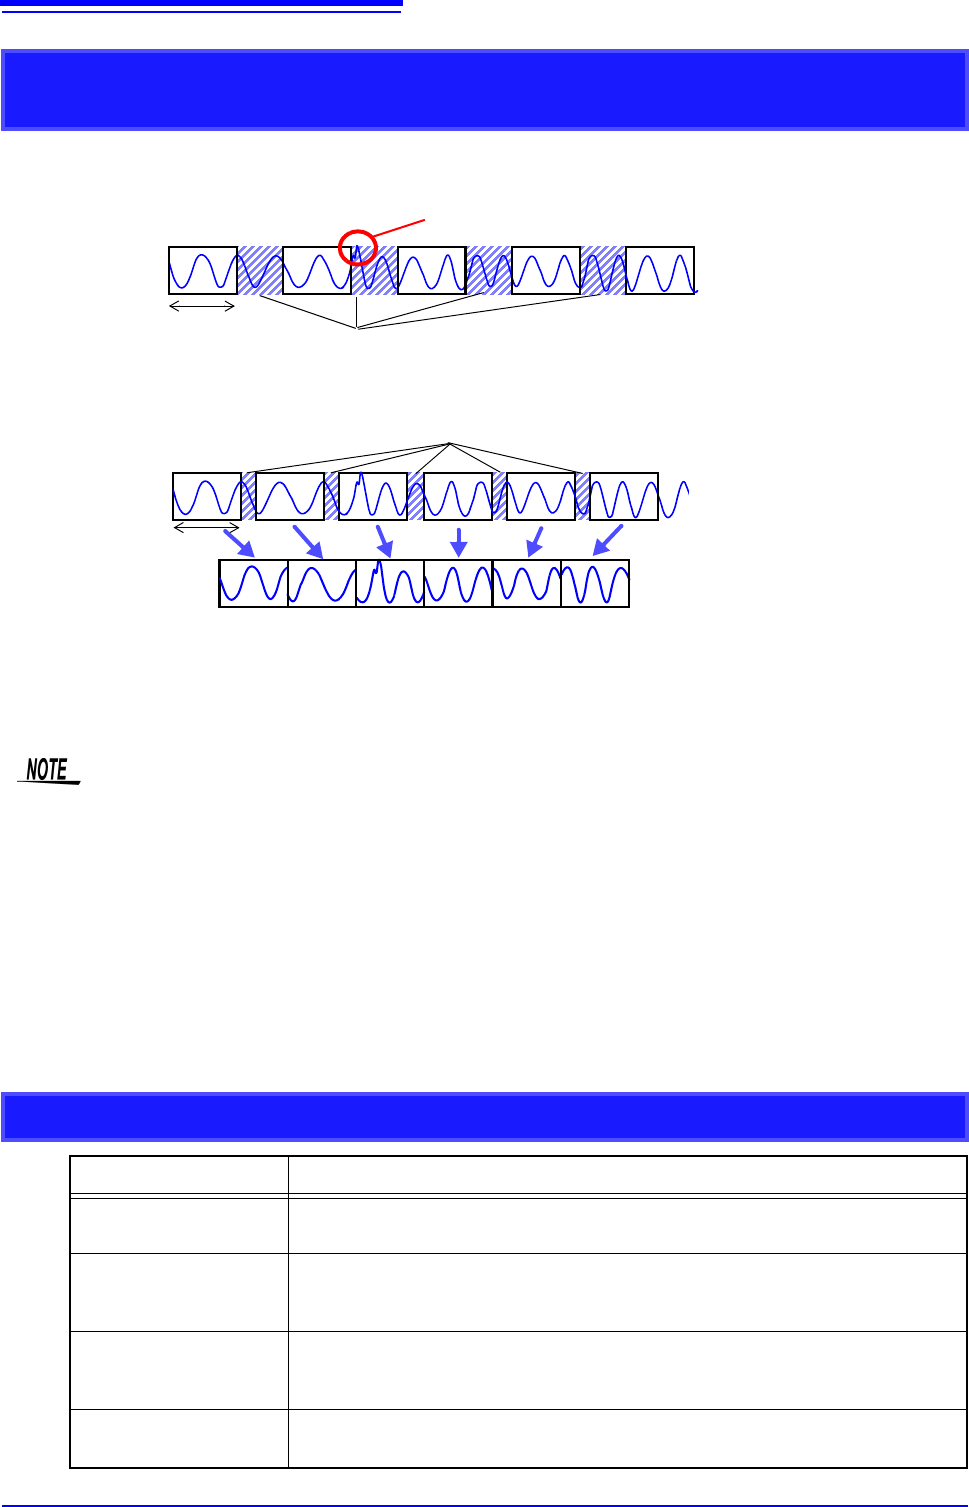
Difference Between Dead Times During Normal and Memory Division
Recording
When Auto Save is set for continuous triggering [Repeat]
Dead Times
Times during which sampling is inhibited due to internal processing or saving
Recording
Length
Anomalous phenomena occurring during dead times are not detected.
When the Trace Waveform Display is disabled (Off) during Memory Division
recording
12 34 56
Recording
Length
Dead Times
The waveform data of each recording length is recorded in one block.
When recording with Memory Division, dead time is shorter than with normal recording.
• The dead time (time where no sampling occurs between blocks) of memory division is as follows.
5 s/div to 20 s/div: 1 to 8 samples
Time axis slower than 50 s/div: 1 samples
Note: Dead time lengthens during numerical calculation or waveform calculation, or when the
time axis is 5 to 20 s/div and tracking waveform display is [On].
• When measuring with an 8970 Freq Unit, dead time is approximately 230 ms. When measuring
in integral value ([Count]) mode, there are cases when the last data in the previous block
remains in the first part of the block.
• When tracking waveform display is [Off], the roll mode function cannot be used, even when roll
mode is enabled (not Off).
• When triggering occurs very often, clicking [STOP] may not stop measurement until enough data
has been acquired to fill the blocks specified for use.
Auto Save for Memory Division Recording
Measuring conditions Auto Save
With Numerical calcula-
tion ON
Auto Save is performed every time one block is measured. When Tracking wave
display is ON, Waveform is also displayed.
When time axis is 5 to 20
s/div with Tracking wave
display ON.
Auto Save and Waveform Display are performed every time one block is measured.
When time axis is 5 to 20
s/div with Tracking wave
display OFF.
Auto Save is performed after all blocks are measured.
Other than above
Auto Save is performed simultaneously with measuring. When Tracking wave dis-
play is ON, Waveform is also displayed.
12.1 Overview and Features
247
11
Chapter 12 FFT Function
12
FFT analysis can only be used with the FFT function.
The FFT (Fast-Fourier Transform) functions provide frequency analysis of input signal data.
Use these functions for frequency analysis of rotating objects, vibrations, sounds and etc.
For details, refer to "Appendix 4 FFT Definitions" (p.A13).
Analysis can be performed on data as it is being measured, on pre-existing analog waveform data previ-
ously acquired with the Memory function, and on data output from waveform calculations.
When Model 8968 High Resolution Unit or Model U8979 Charge Unit, each of which is equipped with the
anti-aliasing filter, is used, the cut-off frequency can be set automatically by linking with the frequency
range setting.
Major Features
•FFT analysis frequency range: 133 mHz to 8 MHz
•FFT Analysis Modes (16 types)
* Not available when using external sampling.
For phase spectra, only the required phase information is highlighted and displayed.
See:"12.3.8 Emphasizing Analysis Results (phase spectra only)" (p.259)
so, when performing FFT analysis with the instrument connected to a sound level or vibration meter, scal-
ing by dB can be set from the Channel Settings screen if you want to read values directly in calibrated
units of measurement.
See:"Scaling" (p.266)
Refer to the "17.2.3 FFT Function" (p.346) for FFT function specifications.
FFT Function
Chapter 12
12.1 Overview and Features
• Storage Waveform • Cross-power Spectrum
• Histogram • Impulse Response
• Linear Spectrum • Coherence Function
• RMS Spectrum • Phase Spectrum
• Power Spectrum • Auto-correlation Function
• Power Spectrum Density* • Cross-correlation Function
• LPC analysis (Power Spectrum
Density)
*
• 1/1 Octave Analysis*
• Transfer Function • 1/3 Octave Analysis*
To suppress the effects of aliasing distortion
• We recommend using Model 8968 High Resolution Unit that are equipped with anti-aliasing filter-
ing to suppress the effects of aliasing distortion when sampling.
• FFT analysis cannot be performed for MR8990 Digital Voltmeter Unit.
See: Aliasing Distortion and Anti-Aliasing Filters
"Appendix 4 FFT Definitions" (p.A13)
12.2 Operation Workflow
248
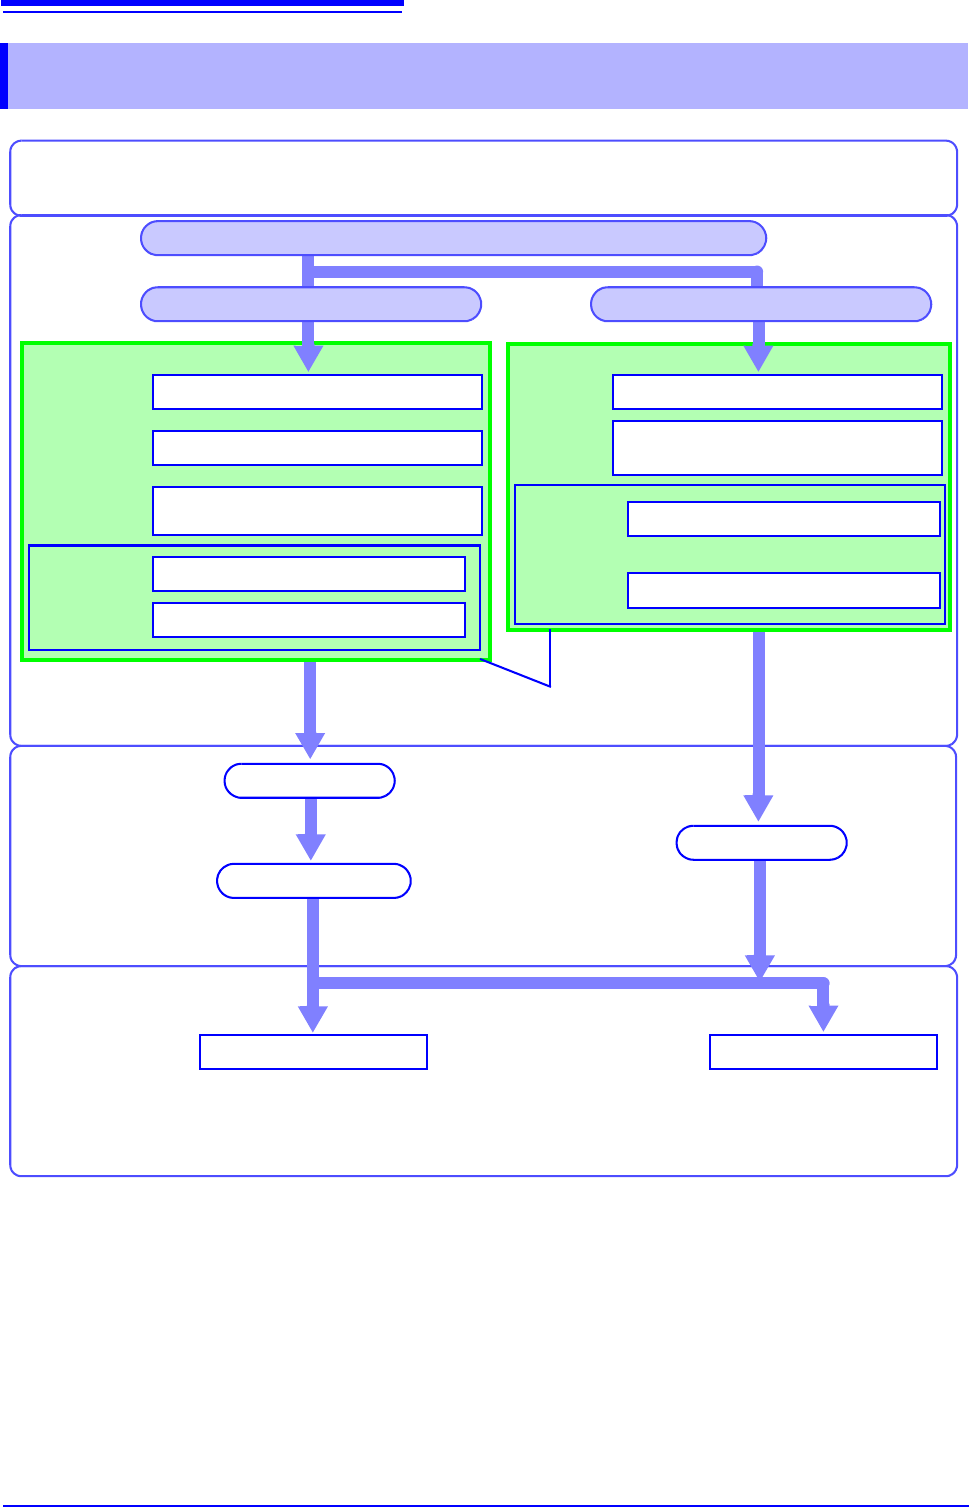
12.2 Operation Workflow
Recording and
Calculation
Settings
Set FFT analysis (p.249)
Set the input channel (p.266)*1
Set trigger criteria (p.189) *1
Analysis and
Saving
SaveAnalyze
[Exec]
or
[START]
Waveform screen
Installation & Connections
"Chapter 2 Measurement Preparations" (p.35)
See: "12.6 Saving Analysis
Results" (p.272)
See: "12.7 Analysis with the
Waveform Screen" (p.273)
Settings for saving (p.272) *1, *2
Set the screen layout of the
Waveform screen (p.267)
Turn Power On
Finish by clicking [STOP] or automatically
(depending on trigger settings)
*1: Settings are the same as for the Memory function.
*2: Even after analysis, save settings can be set manually.
Finished Recording
Recording Starts
Measure with New Settings Measure with Existing Settings
Set as occasion demands.
Set FFT analysis (p.249)
[START]
Calculation occurs after acquiring the
waveform.
FFT calculation
Set up input channels (p.266)*1
Set the screen layout of the
Waveform screen (p.267)
Settings for saving (p.272)*1, *2
About internal
operation
"Trigger Modes and Aver-
aging" (p.258)
[Status]
sheet
Set the Function to FFT (p.249)
[Status] sheet
Channel set-
tings window,
[Each Ch]
sheet
[Status] sheet
Trigger set-
tings window
[File Save]
sheet
Channel set-
tings window,
[Each Ch]
sheet
[File Save]
sheet