MR8740、MR8741_user_manual_eng_20191016H.pdf - 第415页
Appendix 4 FFT Definitions A 19 Appendix A veraging ________________________________________ _____________ With the FFT function, ave raging is perf o rmed according to the following analyti- cal expressio ns. Averaging …
Appendix 4 FFT Definitions
A18
Imaging ______________________________________________________
When the instrument is set to a measurement frequency range that requires a
higher sampling rate than the maximum capability of the module, intermediate
data points are interpolated between successive data samples. In this case, the
time-domain waveform exhibits a stair-step shape. When FFT analysis is per-
formed in this situation, non-existent high frequency spectral components
appear. This phenomena is called zero-order hold characteristic imaging.
The following figures show the time-domain waveform and spectrum of a sine
wave applied to the Model 8968 High Resolution Unit.
To avoid imaging phenomena when analyzing waveforms with the FFT function,
verify the maximum sampling frequency of the module before measuring.
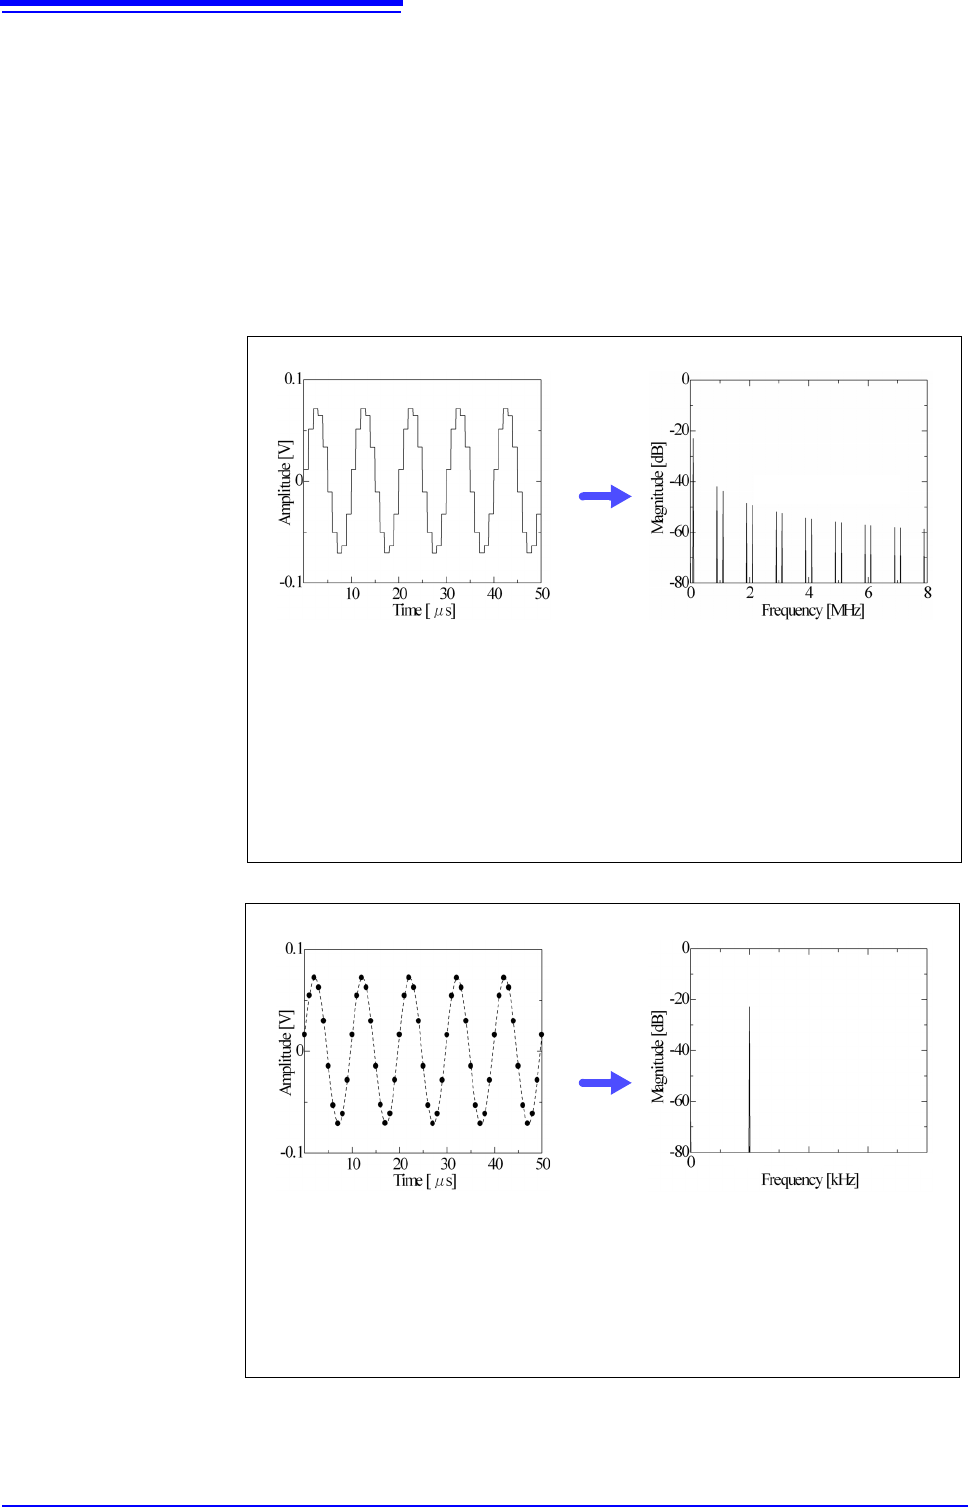
Spectral Imaging
Time-domain waveform
in the 8 MHz frequency range
(sampling frequency = 20 MHz)
Spectrum
The highest sampling frequency of the
Model 8968 is 1 MHz, so the same input
data value is used for each block of 20
samples, resulting in a stair-step wave-
form.
When FFT processing is performed on
a stair-step waveform, the resulting
spectrum shows non-existent compo-
nents.
In this case, the spectral components
above 1 MHz / 2 = 500 kHz are theoret-
ically meaningless.
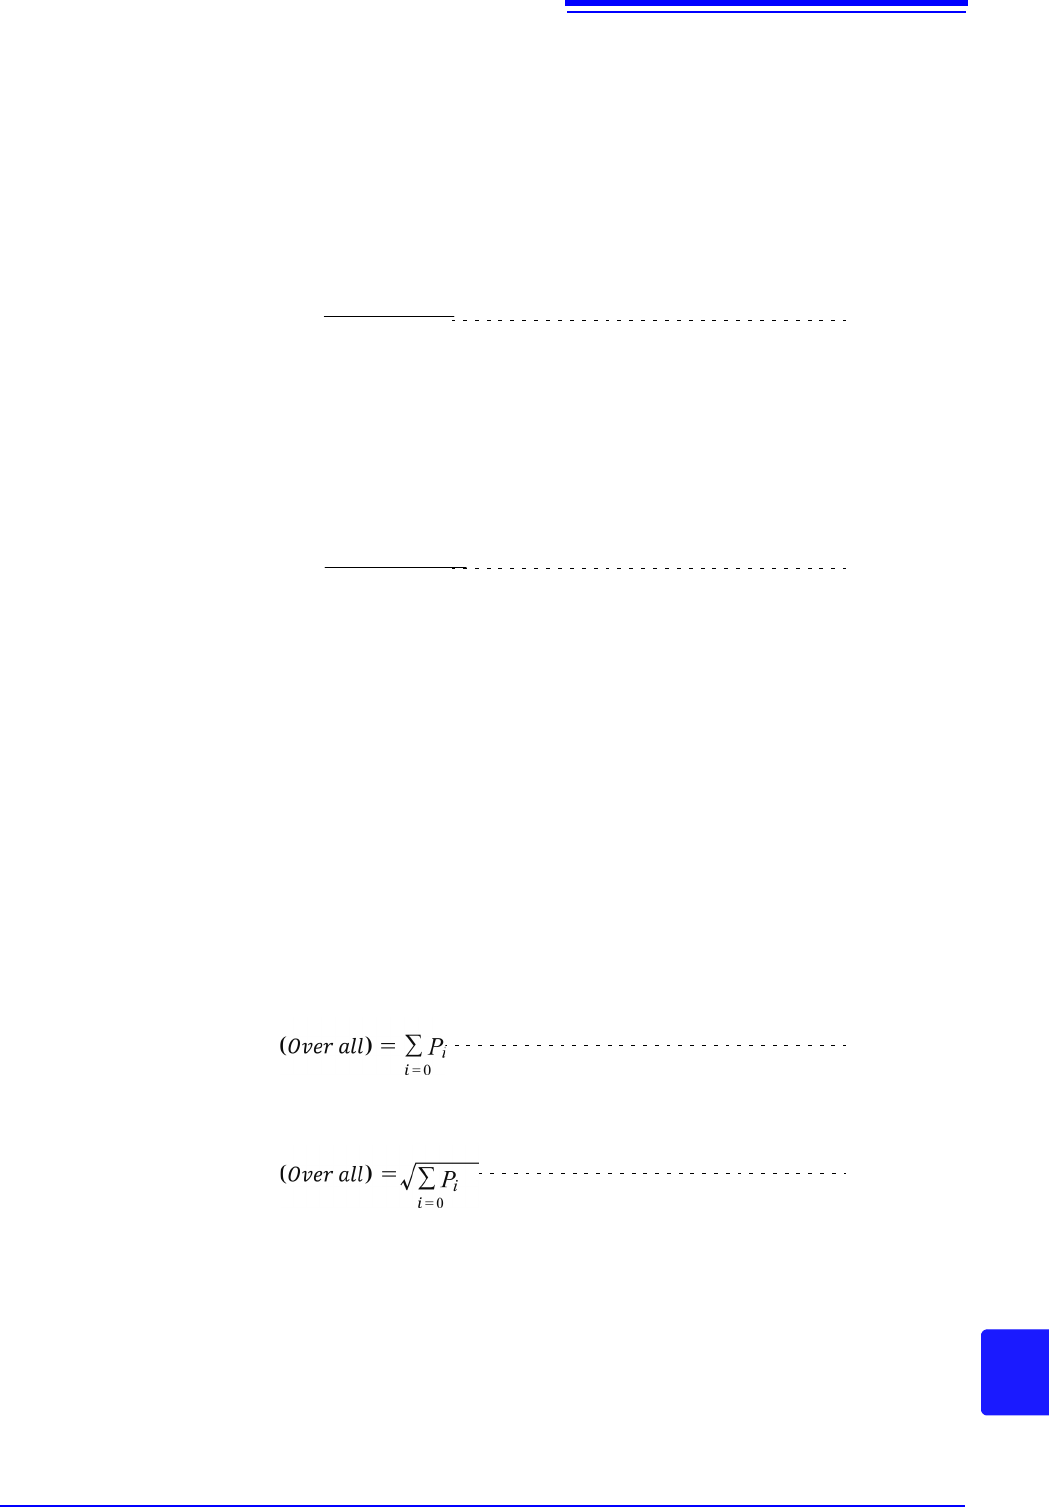
Spectrum
Here, the frequency range matches the
sampling frequency of the Model 8968 so
no interpolation is performed on the time-
domain data.
Time-domain waveform
in the 400 kHz frequency range
(sampling frequency = 1 MHz)
100 200 300
400
Appendix 4 FFT Definitions
A19
Appendix
Averaging_____________________________________________________
With the FFT function, averaging is performed according to the following analyti-
cal expressions. Averaging in the time domain produces meaningless data if per-
formed with inconsistent trigger criteria.
1. Simple Averaging (Time and Frequency Domains)
Sequences of acquired data are summed and divided by the number of acquisi-
tions.
n: count of measurements to average
A
n
: averaging results of n counts
Z
n
: measurement data of n counts
2. Exponential Averaging (Time and Frequency Domains)
Before averaging, newer data is given exponentially greater significance than
older data.
N: Specified number of counts to average
n: count of measurements to average
A
n
: averaging results of n counts
Z
n
: measurement data of n counts
Overall Value __________________________________________________
The overall value is the sum of the power spectrum at each frequency. This
value is equal to the positive sum of the squares of the (RMS) input signals,
except when frequency averaging is performed. The FFT function of this instru-
ment calculates and displays the RMS values for stored waveforms and the
overall value from the sum of the power spectrum for the frequency domain. Any
FFT analysis modes other than the power spectrum, however, take the root
square of the overall value to match the unit.
P
i
: power spectrum of value i
(11)
n
ZAn
A
nn
n
1
)1(
(12)
N
ZAN
A
nn
n
1
)1(
(13-1)
With the FFT analysis mode set to the power spectrum
With the FFT analysis mode set to the histogram, linear spectrum, RMS spec-
trum, impulse response, 1/1 octave analysis, or 1/3 octave analysis
(13-2)

Appendix 4 FFT Definitions
A20
Total harmonic distortion (THD) __________________________________
Total harmonic distortion (THD) indicates the proportion of the higher harmonics
to the fundamental harmonic
This means that the larger the value, the more distorted the waveform.
THD
f
n
2
f
0
2
---------------
100=
f
0
= fundamental wave
f
n
= n next higher harmonic
[%]
(14)