MR8740、MR8741_user_manual_eng_20191016H.pdf - 第268页
12.3 Setting FFT Analysis Conditio ns 256 The averaging functio n calculates t he average of the values obtained fr om mu ltiple measurements of a peri- odic waveform. This can reduce noise and o ther non-pe riodic signa…
12.3 Setting FFT Analysis Conditions
255
11
Chapter 12 FFT Function
12
Either local or global maxima ([maximal]/ [maximum]) of the input signal and analysis results can
be displayed on the Waveform screen. However, if Nyquist display is selected on the Status screen-
[Status] sheet, no peak values are displayed.
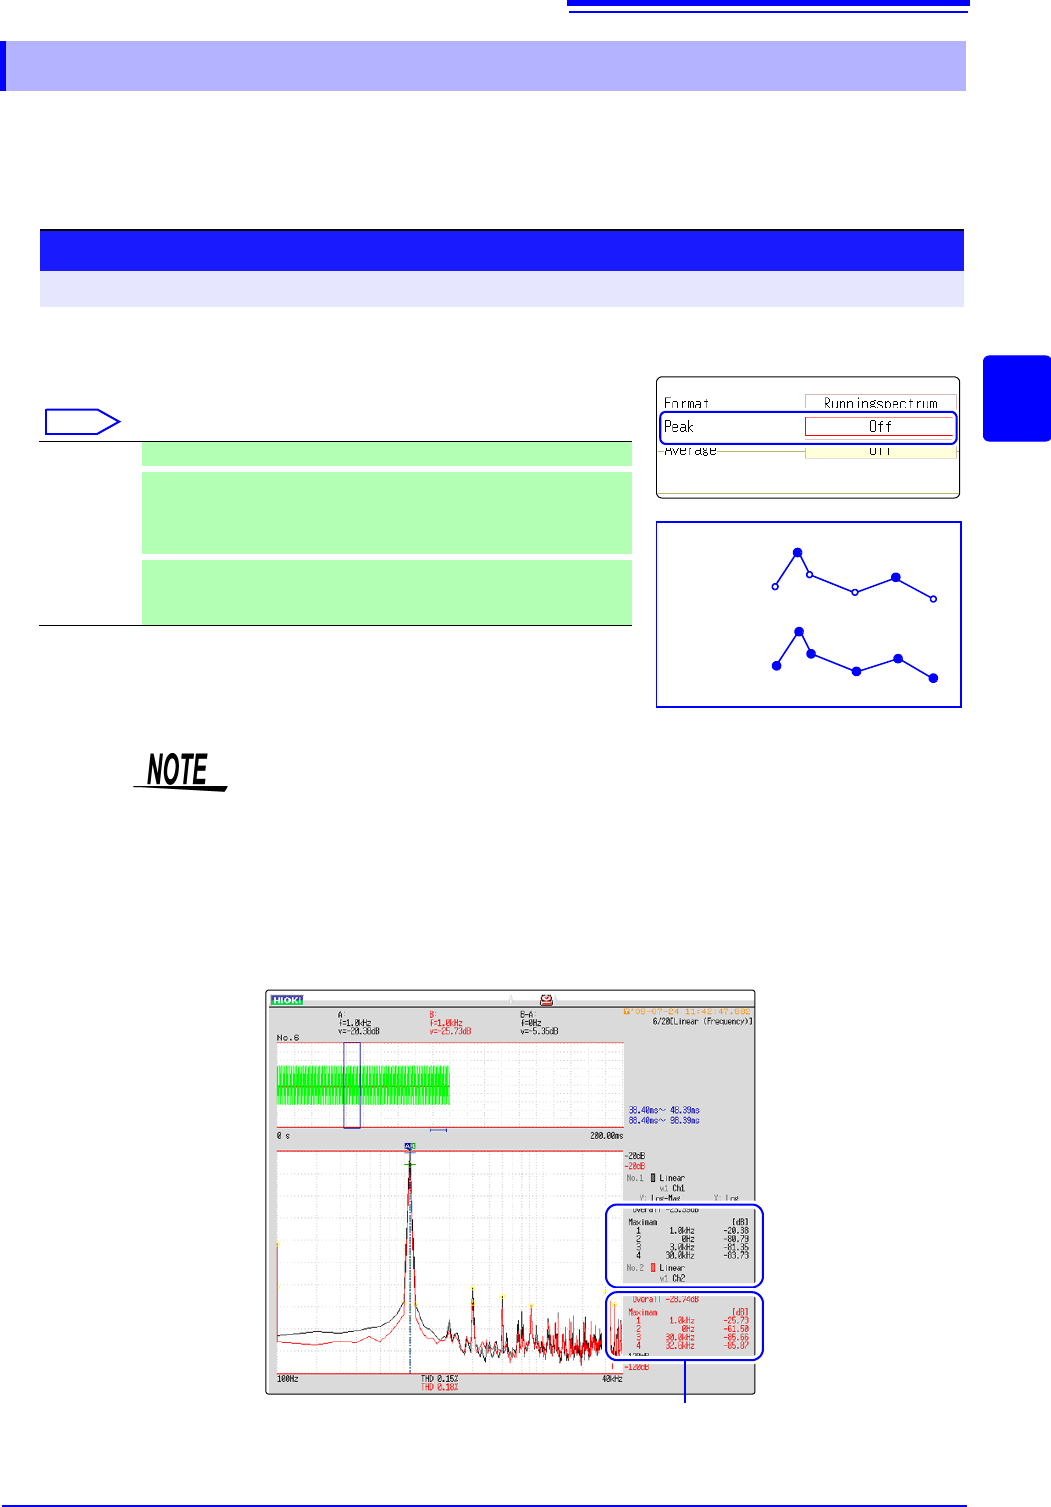
12.3.6 Setting Peak Values of Analysis Results
Selecting peak value display.
Move the flashing cursor to the [Peak] item.
Select
Off Not displayed. (default setting)
Maximal
(local maxima)
When the value of data at a point is greater than that of the adjacent
points, that data is considered a local maxima. The ten largest local
maxima are displayed.
Maximam
(global maxima)
Among all data values, the ten points with the greatest values are
displayed.
Procedure
To open the screen: Right-click and select [STATUS] [Status] sheet
Maximal
Maximam
2
3
2
4
5
6
1
1
• No display occurs if peak values cannot be detected.
• Peak values on the Waveform screen can be displayed, but cannot be saved
as peak values in text files.
• Depending on the split screen status, display ten peak values may not be pos-
sible. In such cases, only the displayable number is displayed, starting from
large items.
Example: When the reference data setting is [From Memory]
Peak value display
From 1 to 4
12.3 Setting FFT Analysis Conditions
256
The averaging function calculates the average of the values obtained from multiple measurements of a peri-
odic waveform. This can reduce noise and other non-periodic signal components. Averaging can be applied
to a time-domain waveform or to a spectrum.
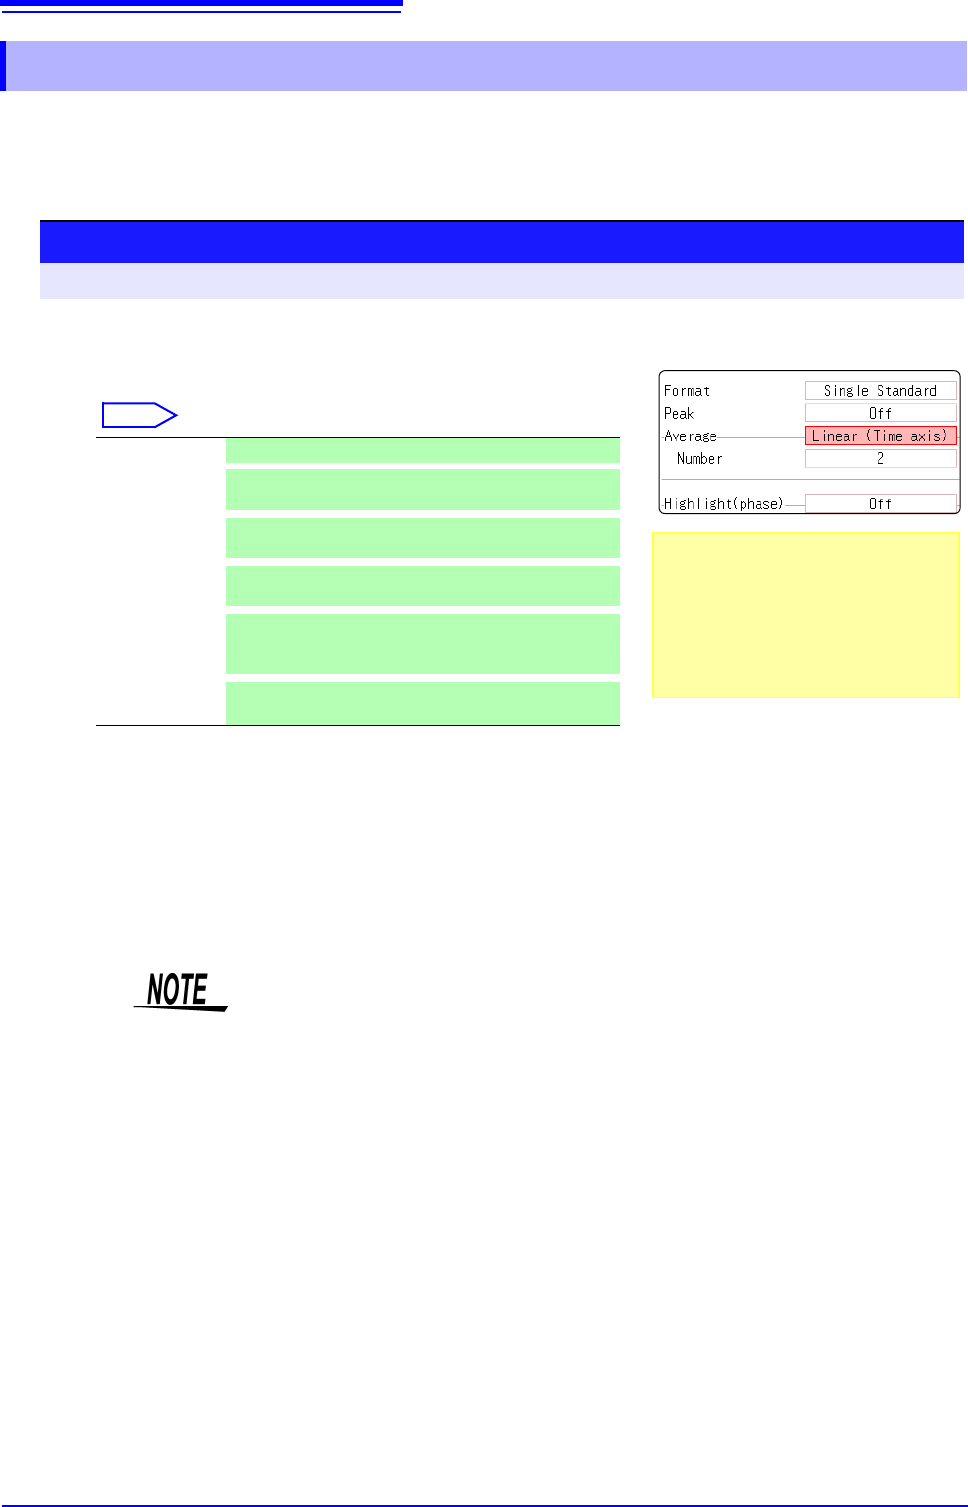
12.3.7 Averaging Waveforms
1
Enable averaging.
Move the flashing cursor to the [Average] item.
Select
2
Select the count for averaging.
Move the flashing cursor to the [Number] item.
Select the number of measurements to be averaged.
Setting range: 2 to 10,000
Off Averaging is disabled. (default setting)
Linear
(Time axis)
Time-domain waveforms are summed and averaged
and then calculation is performed.
Expo.
(Time axis)
The exponential mean of time-domain waveforms is
determined and then calculation is performed.
Linear
(Frequency)
Frequency-domain waveforms are summed and aver-
aged and then the calculation result is output.
Expo.
(Frequency)
The exponential mean of frequency-domain wave-
forms is determined and then the calculation result is
output.
Peak
(Frequency)
The maximum value of frequency-domain waveforms
is retained.
Procedure
To open the screen: Right-click and select [STATUS] [Status] sheet
About averaging calculation formulas
See: "Averaging" (p.A19)
When averaging and auto saving are
enabled at the same time
Data is saved after the specified count of
values have been averaged.
See: "Trigger Modes and Averaging"
(p.258)
1
2
• After measuring with averaging enabled, display is not available when the
channel is changed. Also, when the analysis mode is changed, the analysis
modes that can be displayed are limited.
• When averaging is performed with the analysis mode disabled (Off), no trace
is displayed when the analysis mode is changed after measurement.
• When [Format] is set to [Running spectrum], [Average] cannot be set.
12.3 Setting FFT Analysis Conditions
257
11
Chapter 12 FFT Function
12
FFT Analysis Modes and Averaging
When averaging time-domain waveform values:
Waveforms are acquired and averaged within the time domain. After averaging, FFT
calculation is performed.
When the trigger mode is [Auto]: Data is acquired when measurement is started, even
if trigger criteria are not met after a certain interval. So if averaging is applied to an asyn-
chronous signal, the resulting data is meaningless.
Synchronous signals have better SNR (signal-to-noise ratio) and are more suitable for
analysis.
When averaging spectrum values:
Acquired data is first subject to FFT analysis. After analysis, averaging is performed
within the frequency range, and the result is displayed. This differs from time-domain av-
eraging in that averaging can be performed without trigger synchronization. However, if
the characteristics of the input waveform allow triggering, using the trigger for synchro-
nization is recommended.
Spectrum peak hold:
After performing FFT calculations on the acquired waveform, peak values are retained
(held) and displayed within the frequency range.
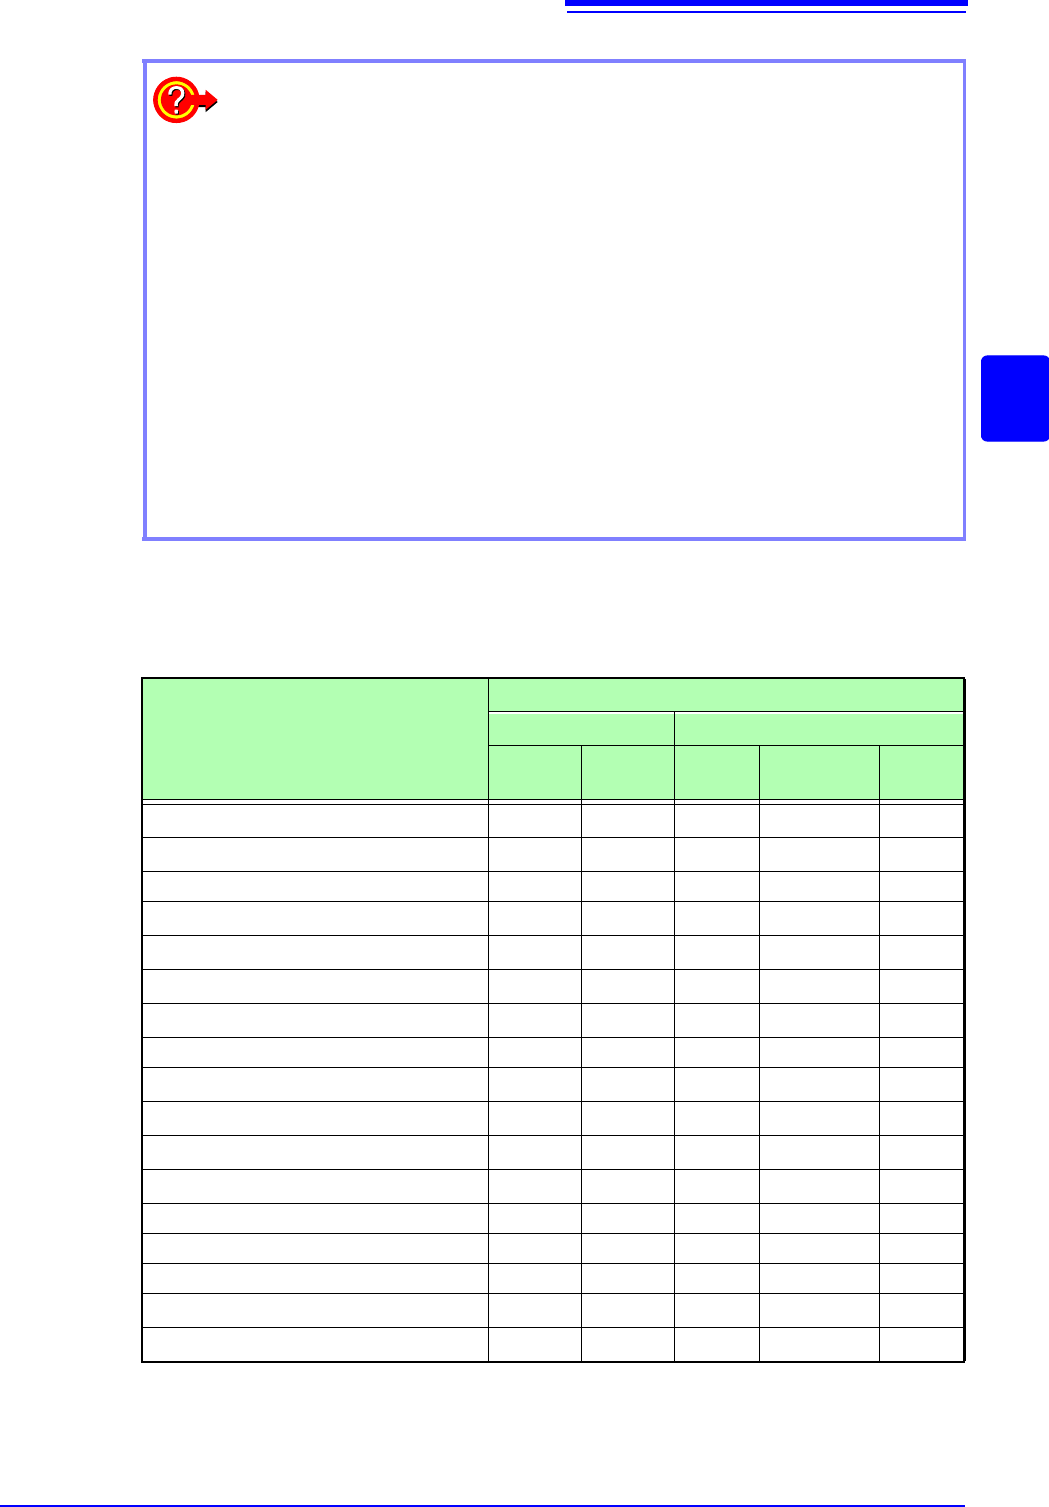
: Settable, ×: Cannot be set,
O
: Partially settable
Analysis Mode
Averaging
Waveform Averaging Spectrum Averaging
Simple
Exponen-
tial
Simple Exponential
Peak
Hold
OFF
×××××
Storage Waveform
×××
Histogram
×××
Linear Spectrum
O
*2
O
*2
O
*2
RMS Spectrum
O
*2
O
*2
O
*2
Power Spectrum
Power Spectrum Density *1
LPC analysis(Power Spectrum Density) *1
×××
Transfer Function
O
*2
O
*2
O
*2
Cross Power Spectrum
O
*2
O
*2
O
*2
Impulse Response
Coherence Function
×××
Phase Spectrum
×××
Auto-correlation Function
Cross-correlation Function
1/1 Octave Analysis *1
1/3 Octave Analysis *1
*1. Not available for external sampling
*2. Not available when the y axis is real (linear) or imaginary (linear), or for Nyquist plots