MR8740、MR8741_user_manual_eng_20191016H.pdf - 第267页
12.3 Setting FFT Analysis Conditio ns 255 11 Chapter 12 FFT Function 12 Either local or global maxima ( [maximal] / [maximum] ) of the input signal and analysis results can be displayed on the Wa veform screen. However, …
12.3 Setting FFT Analysis Conditions
254
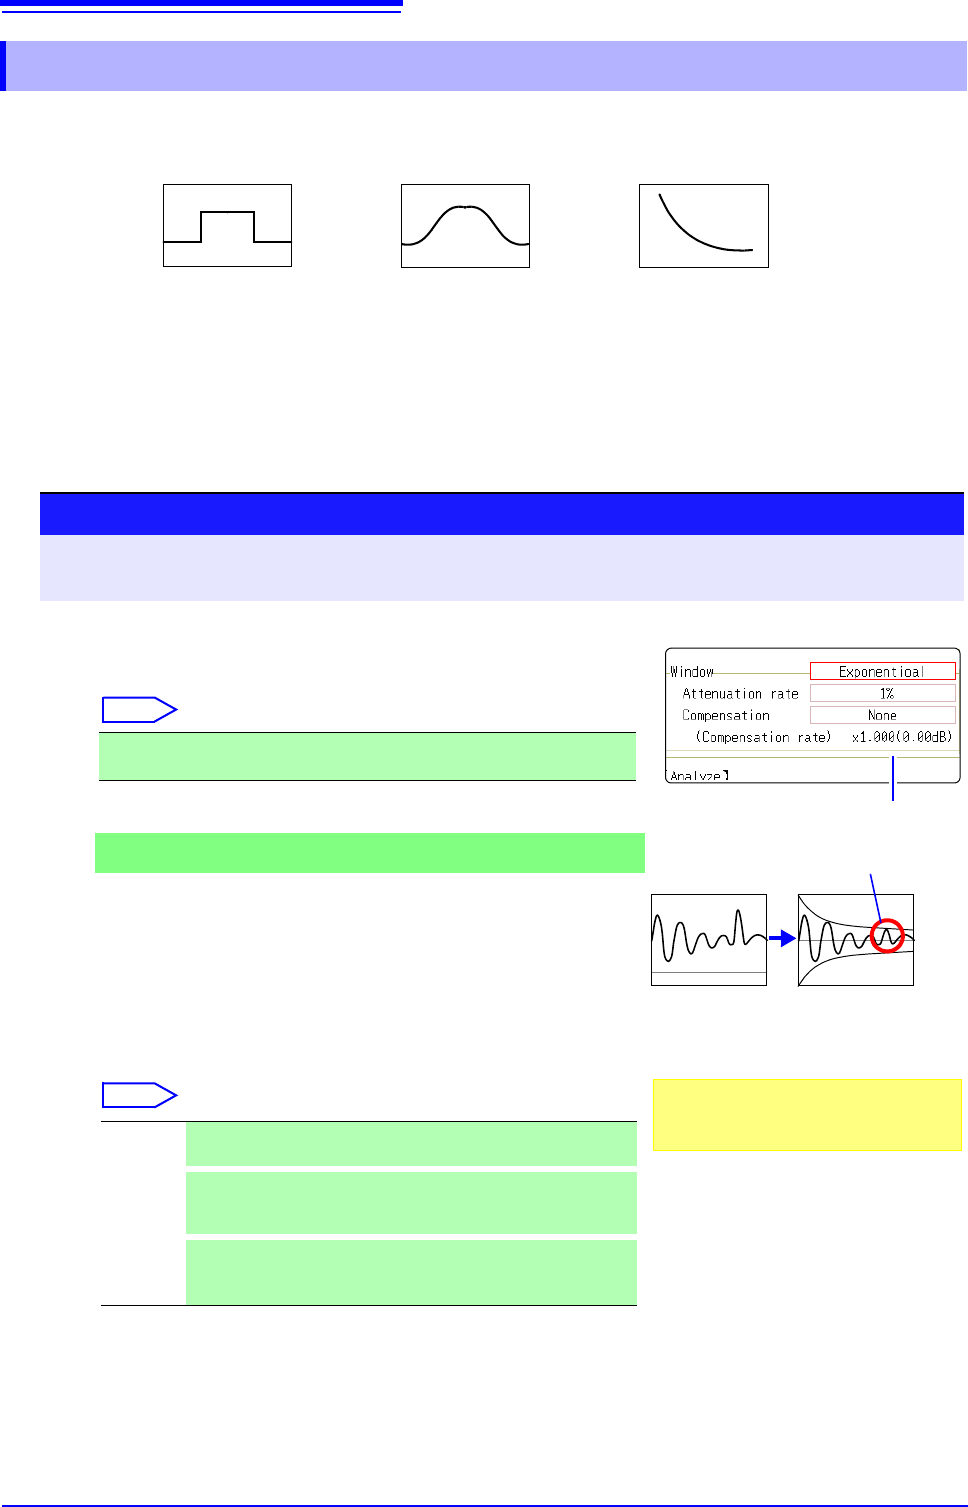
The window function defines the segment of the input signal to be analyzed.
Use the window function to minimize leakage errors. There are three general types of window functions:
The non-rectangular window functions generally produce lower-level analysis results. By applying attenu-
ation correction, the attenuation introduced by the non-rectangular window functions can be corrected to
bring analysis results back to similar levels.
12.3.5 Setting the Window Function
• Rectangular Window
• Hann window
• Hamming window
• Blackman window
• Blackman-Harris window
• Flat top window
• Exponential window
1
Select the window function.
Move the flashing cursor to the [Window] item.
Select
See: "Window Function" (p.A21)
2
If [Exponential] is the selected type
Set the attenuation coefficient (percentage).
Move the flashing cursor to the [Attenuation rate] item.
Set the attenuation coefficient as a percentage.
3
Set attenuation correction.
Move the flashing cursor to the [Compensation] item.
Select
Rectangular (default setting), Hanning, Hamming, Blackman, Black-
man Harris, Flat-top, Exponential
None Attenuated window function values are not corrected.
(default setting)
Power
The window function multiplies the power levels of the time-do-
main waveform so that output levels are comparable to those
of a rectangular window.
Average
The window function multiplies the average value of the time-
domain waveform so that output levels are comparable to
those of a rectangular window.
Procedure
To open the screen: Right-click and select [STATUS] [Status] sheet
See: To set from the Waveform screen (p.265)
Correction value
For the rectangular window function:
The correction value is always 1 (0 dB).
When the attenuation rate is 10%
10%
100%
Noise is suppressed in the attenuated wave-
form.
2
1
3
12.3 Setting FFT Analysis Conditions
255
11
Chapter 12 FFT Function
12
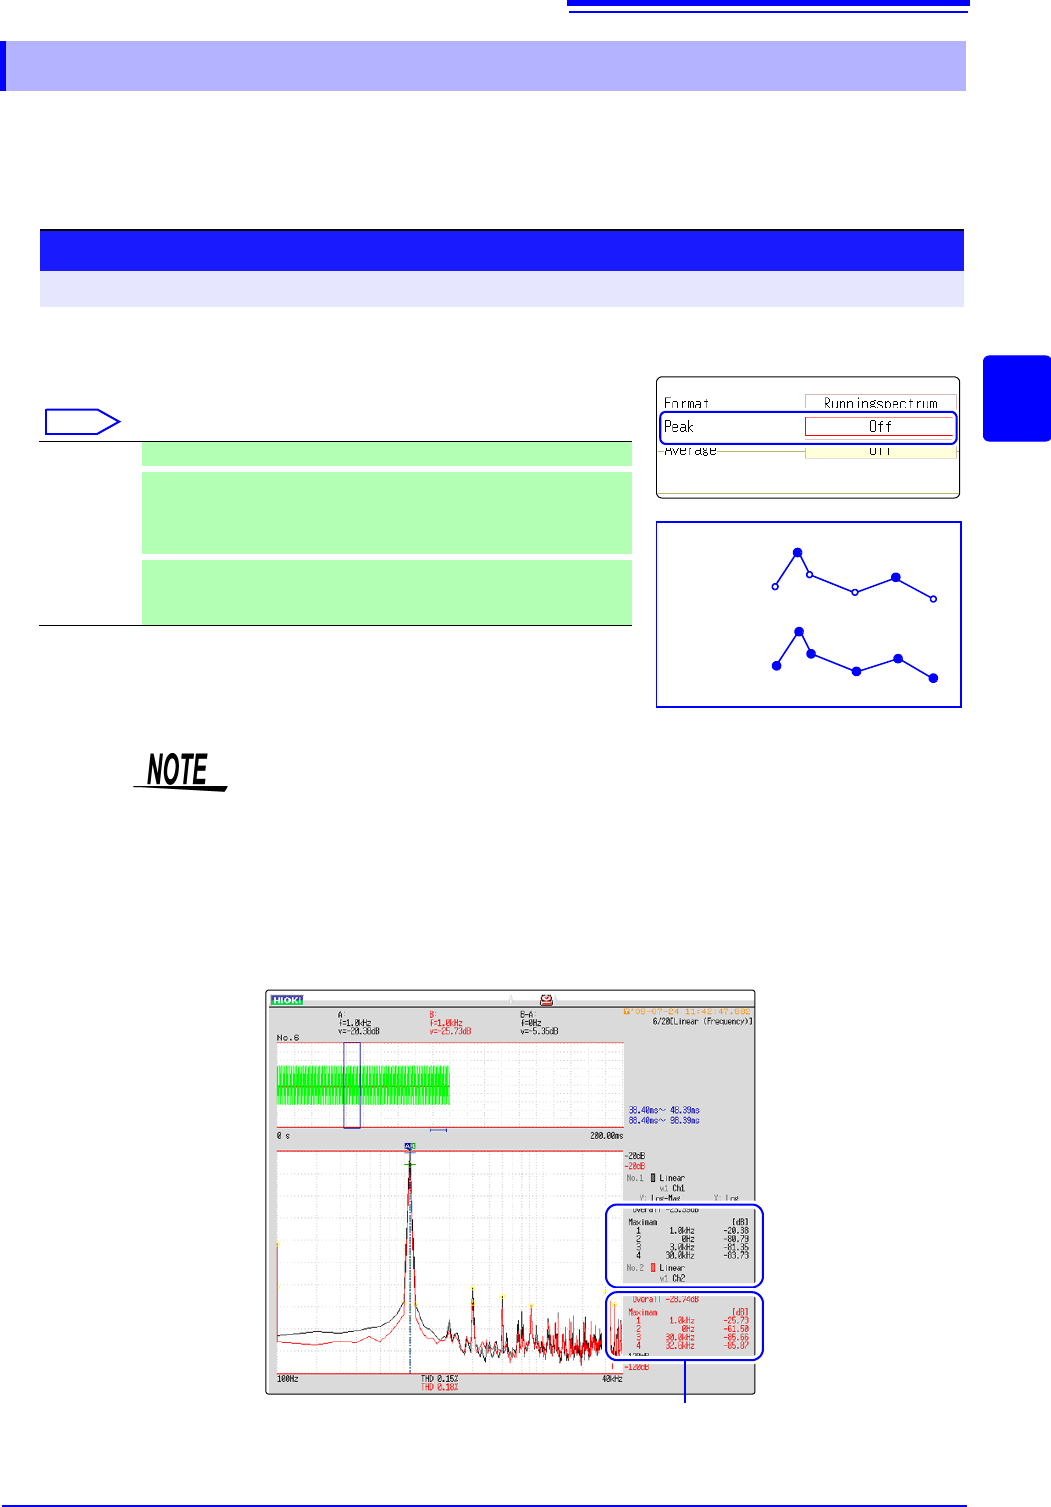
Either local or global maxima ([maximal]/ [maximum]) of the input signal and analysis results can
be displayed on the Waveform screen. However, if Nyquist display is selected on the Status screen-
[Status] sheet, no peak values are displayed.
12.3.6 Setting Peak Values of Analysis Results
Selecting peak value display.
Move the flashing cursor to the [Peak] item.
Select
Off Not displayed. (default setting)
Maximal
(local maxima)
When the value of data at a point is greater than that of the adjacent
points, that data is considered a local maxima. The ten largest local
maxima are displayed.
Maximam
(global maxima)
Among all data values, the ten points with the greatest values are
displayed.
Procedure
To open the screen: Right-click and select [STATUS] [Status] sheet
Maximal
Maximam
2
3
2
4
5
6
1
1
• No display occurs if peak values cannot be detected.
• Peak values on the Waveform screen can be displayed, but cannot be saved
as peak values in text files.
• Depending on the split screen status, display ten peak values may not be pos-
sible. In such cases, only the displayable number is displayed, starting from
large items.
Example: When the reference data setting is [From Memory]
Peak value display
From 1 to 4
12.3 Setting FFT Analysis Conditions
256
The averaging function calculates the average of the values obtained from multiple measurements of a peri-
odic waveform. This can reduce noise and other non-periodic signal components. Averaging can be applied
to a time-domain waveform or to a spectrum.
12.3.7 Averaging Waveforms
1
Enable averaging.
Move the flashing cursor to the [Average] item.
Select
2
Select the count for averaging.
Move the flashing cursor to the [Number] item.
Select the number of measurements to be averaged.
Setting range: 2 to 10,000
Off Averaging is disabled. (default setting)
Linear
(Time axis)
Time-domain waveforms are summed and averaged
and then calculation is performed.
Expo.
(Time axis)
The exponential mean of time-domain waveforms is
determined and then calculation is performed.
Linear
(Frequency)
Frequency-domain waveforms are summed and aver-
aged and then the calculation result is output.
Expo.
(Frequency)
The exponential mean of frequency-domain wave-
forms is determined and then the calculation result is
output.
Peak
(Frequency)
The maximum value of frequency-domain waveforms
is retained.
Procedure
To open the screen: Right-click and select [STATUS] [Status] sheet
About averaging calculation formulas
See: "Averaging" (p.A19)
When averaging and auto saving are
enabled at the same time
Data is saved after the specified count of
values have been averaged.
See: "Trigger Modes and Averaging"
(p.258)
1
2
• After measuring with averaging enabled, display is not available when the
channel is changed. Also, when the analysis mode is changed, the analysis
modes that can be displayed are limited.
• When averaging is performed with the analysis mode disabled (Off), no trace
is displayed when the analysis mode is changed after measurement.
• When [Format] is set to [Running spectrum], [Average] cannot be set.