MR8740、MR8741_user_manual_eng_20191016H.pdf - 第276页
12.3 Setting FFT Analysis Conditio ns 264 The display r ange of the vertic al (y) axis can be set t o automatically suit an alysis results, and can b e freely expanded and compressed. 12.3.10Setting the Display Range of …

12.3 Setting FFT Analysis Conditions
263
11
Chapter 12 FFT Function
12
Total harmonic distortion (THD)
When the analysis mode is one of the following, the cursor appears and the distortion rate is calculated.
(Linear spectrum, RMS spectrum, power spectrum)
The distortion rate calculates the cursor position as the fundamental wave. When 2 cursors appear, the A
cursor becomes the fundamental wave.
When calculation results cannot be obtained, [---%] is displayed.
Note that distortion rate values may become higher depending on the window function settings.
THD
f
n
2
f
0
2
---------------
100=
f
0
=fundamental wave
f
n
= n next higher harmonic
[%]
12.3 Setting FFT Analysis Conditions
264
The display range of the vertical (y) axis can be set to automatically suit analysis results, and can be freely
expanded and compressed.
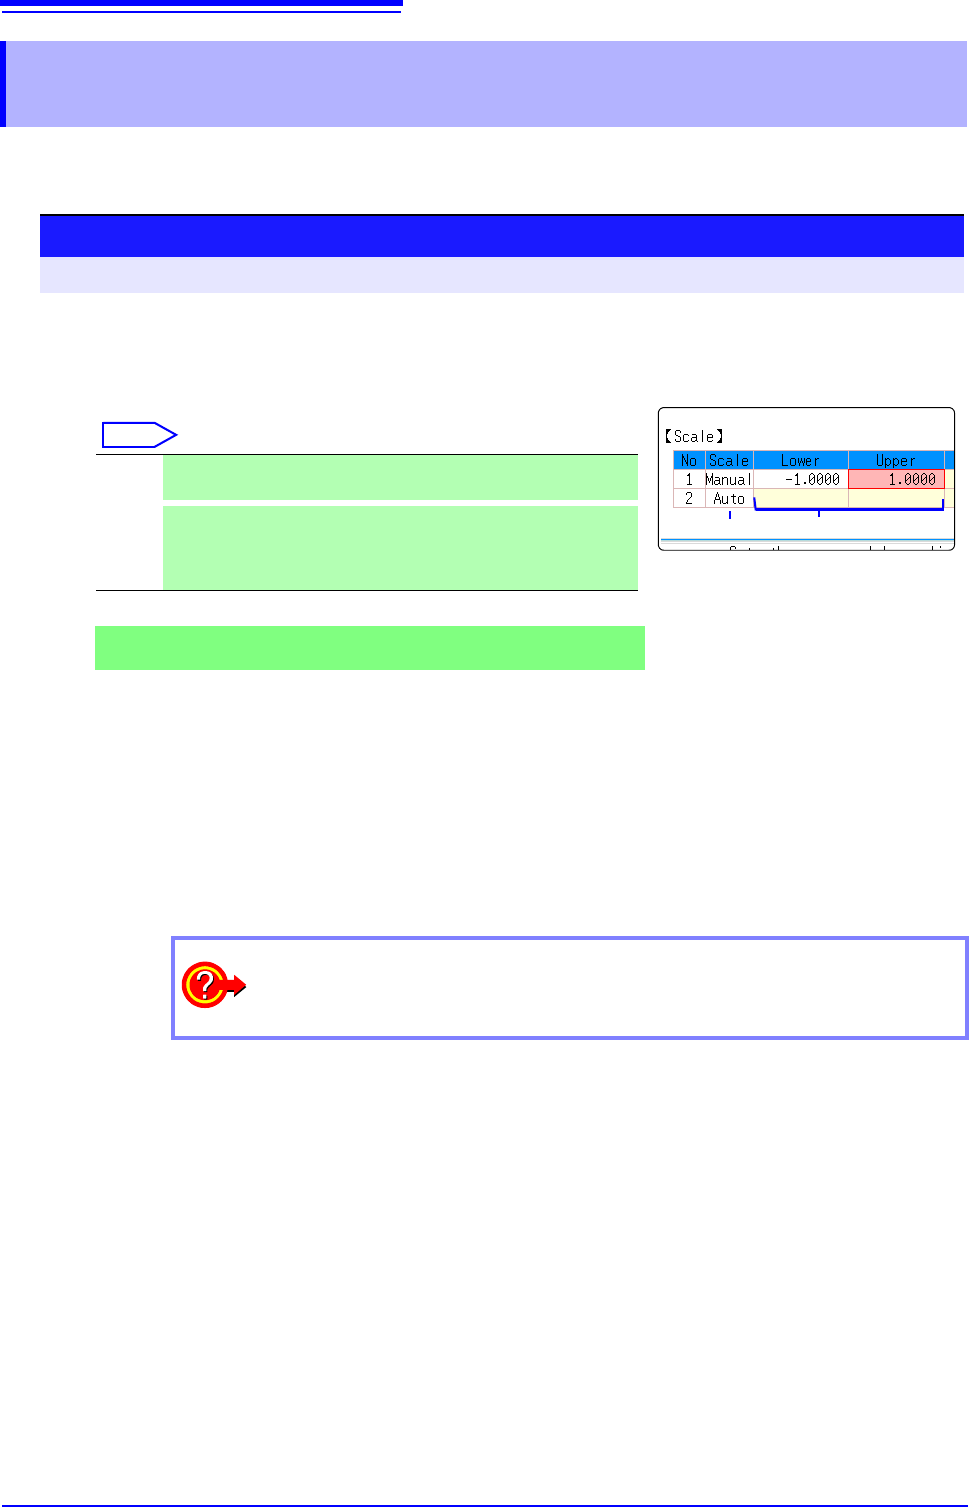
12.3.10Setting the Display Range of the Vertical Axis
(Scaling)
12
1
Select automatic or manual scaling of the y-axis display.
Move the flashing cursor to the [Scale] column of the Analysis No.
to set.
Select
2
When [Manu] is selected
Set the upper and lower limits to display.
Move the flashing cursor to the
[Lower] or [Upper] item.
Set the upper and lower limits to display the analysis results.
Setting range: -9.9999E+29 to +9.9999E+29
(with exponent from E-29 to E+29)
See: "7.1.3 Alphanumeric Input" (p.141)
Auto Scaling of the vertical (y) axis is automatically set according to
analysis results. (default setting)
Manu-
al
Scaling of the vertical (y) axis can be set as desired, to suit the pur-
pose of the measurement.
This is useful for magnifying or reducing the displayed amplitude,
and for shifting the displayed waveform up or down.
Procedure
To open the screen: Right-click and select [STATUS] [Status] sheet
How do I copy settings to other calculation No.?
See: "7.8 Copying settings to other channels (calculation No.) (Copy function)" (p.160)
12.3 Setting FFT Analysis Conditions
265
11
Chapter 12 FFT Function
12
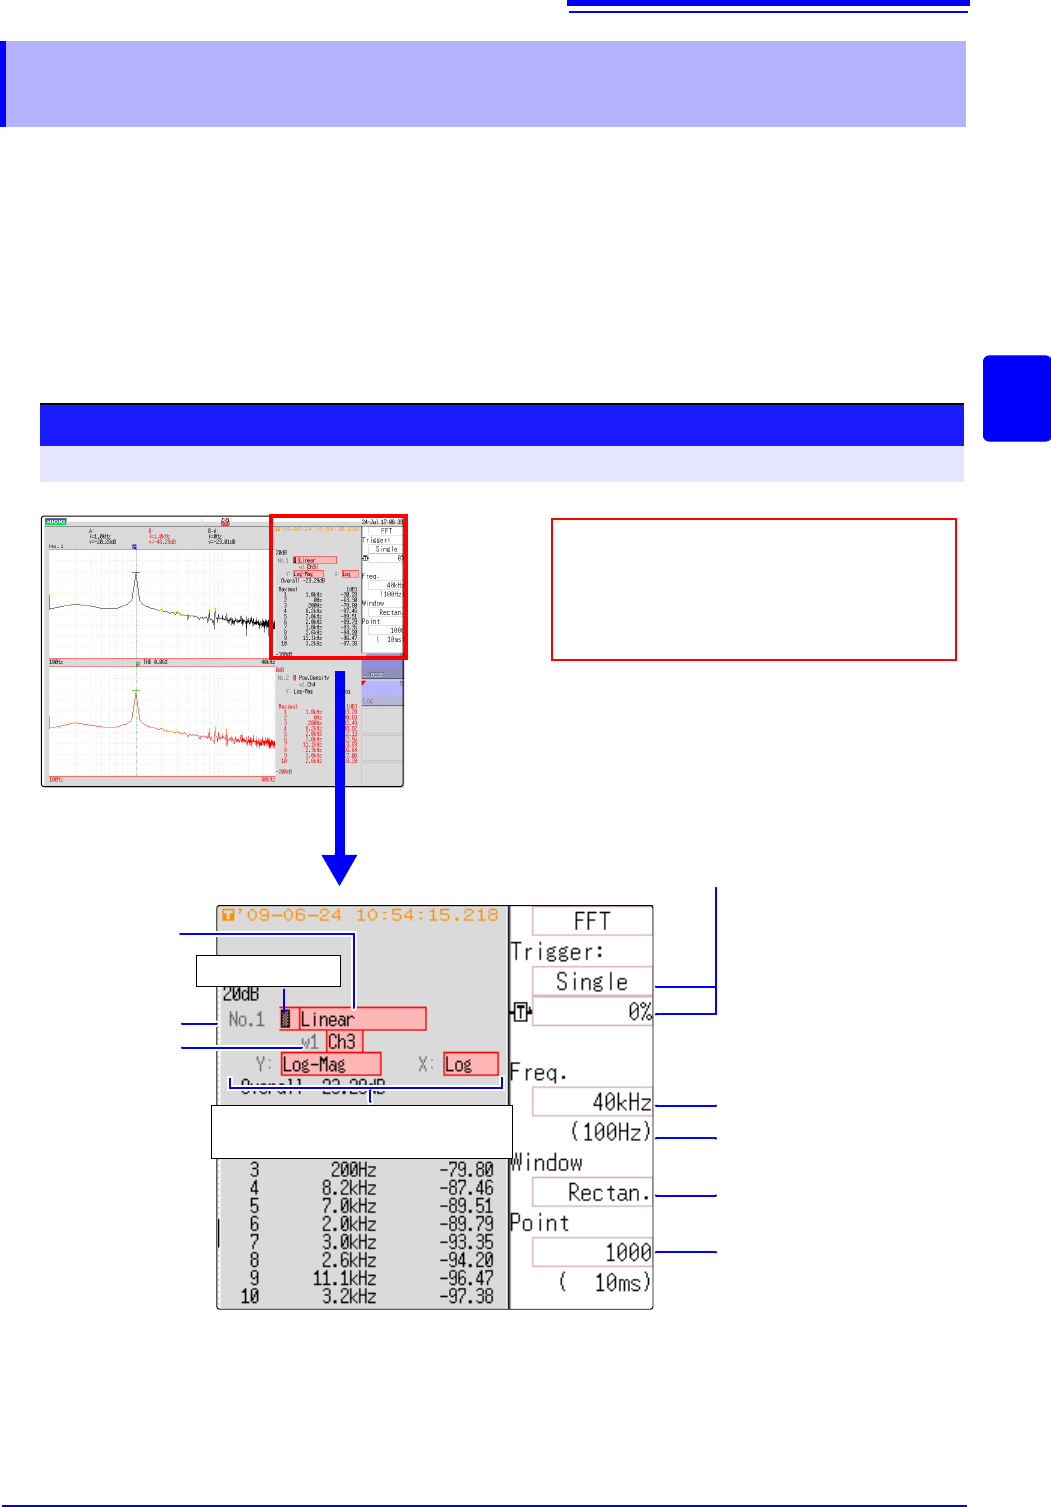
The following settings can be made on the Waveform screen.
Changes to the displayed analysis results become effective when the settings are changed.
• Available settings are frequency range, number of analysis points, type of win-
dow function, trigger mode and pre-triggering
• Available settings are analysis number, analysis mode, waveform color, analy-
sis channel and x/y axis display type
• Trigger settings (p.192)
(Note: If [Reference] is [From Memory], triggers cannot be set.)
12.3.11Setting and Changing Analysis Conditions on
the Waveform Screen
Trigger mode and Pre-trigger
Select the trigger mode and pre-triggering (same as fo
the Memory function).
Trigger Mode: Single, Repeat, Auto
Pre-trigger: Select from list
See: "8.2 Setting the Trigger Mode" (p.191)
"8.9 Pre-Trigger Settings" (p.204)
Number of Analysis Points
(p.251)
(1000, 2000, 5000, 10000)
Frequency Resolution (dur-
ing acquisition)
Select the frequency range (133
mHz to 8 MHz). (p.251)
FFT Window Function Type
(p.254)
Setting method
Use the mouse to move the flashing cursor
to each item, and select a setting from the
GUI displayed on the bottom right of the
screen.
Analysis
Numbe*(p.260)
Analysis Channel
Analysis
Mode
*Coupled with the [Analy-
sis] list at the [Status]
sheet of the Status screen.
Display types of X-axis (horizontal
axis) and Y-axis (vertical axis)
Setting details
To open the screen: Right-click and select [DISP] Waveform screen
Waveform Color