MR8740、MR8741_user_manual_eng_20191016H.pdf - 第134页
6.1 Reading Measurement Values (Using the A/B Cursors) 122 <Screen display (time ax is cursor)> You can click [DISP] to display the wave form and cursor values separately. See: "6.7.3 Switching the Waveform Di…
6.1 Reading Measurement Values (Using the A/B Cursors)
121
5
Chapter 6 Waveform Screen Monitoring and Analysis
6
If numerical values are hard to read
Right-click and select [DISP] to enable display selection. You can display the wave-
form and numerical values separately.
See: "6.7.3 Switching the Waveform Display Width" (p.135)
To view the waveform before or after the A/B cursors when these are off the
screen
When using the A/B cursors, the waveform at an off-screen cursor location can be dis-
played using the Jump function.
See: "6.3.3 Moving the Position" (p.126)
If A/B cursors are activated but do not show up on screen
The position of the A/B cursors can be checked on the scroll bar.(p.125)
If the cursor type is [div] or [Trace] cursors, cursor measurements can be made even
if the A or B cursor is off-screen.
6.1 Reading Measurement Values (Using the A/B Cursors)
122
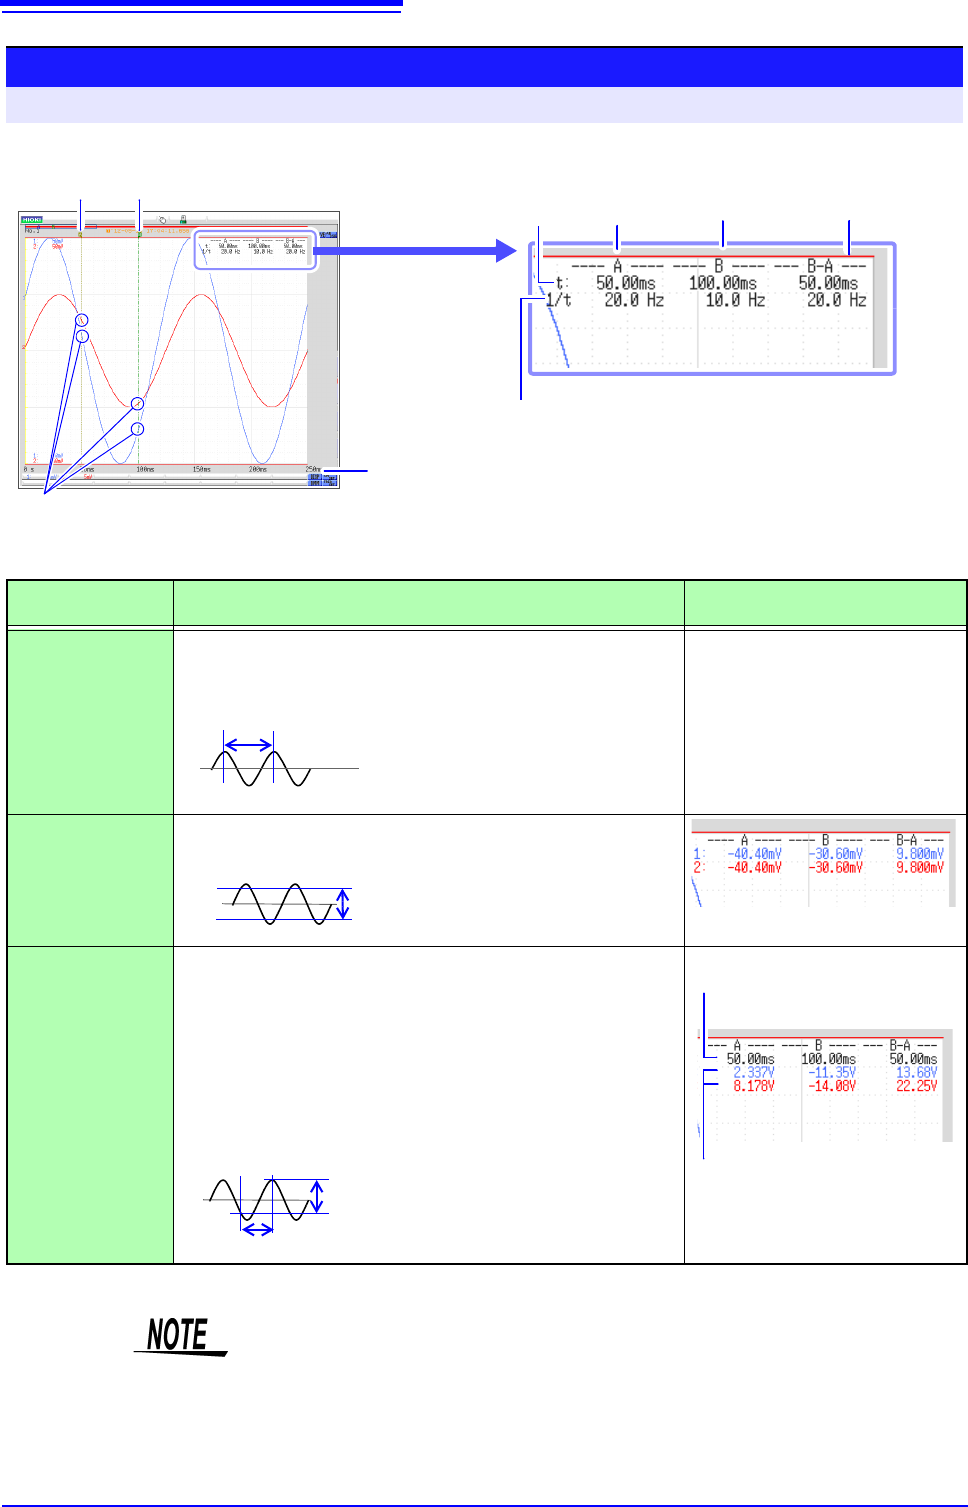
<Screen display (time axis cursor)>
You can click [DISP] to display the waveform and cursor values separately.
See: "6.7.3 Switching the Waveform Display Width" (p.135)
Reading Measurement Values on Waveform Screen (for 1, 2, 4, 8, 16 screens)
To open the screen: Right-click and select [DISP] Waveform screen
A Cursor B Cursor
Frequencies
Time Values
Waveform values at the intersection with
each cursor are displayed.
Values Between
A/B cursors
Time Value
To change the display type:
"Time Value" (p. 310)
How cursor values are
displayed depends on
the selected cursor type.
Cursor A
Values
Cursor B
Values
<Cursor Value>
Cursor Type Cursor Value
Cursor Value Display Example
(with two cursors)
div
(Time Value and
Frequency)
t: A, B each cursor value: Time from trigger point or recording
start
B-A value: Time difference between A/B cursors
See "Screen display" above
1/t: Frequency for which t is 1 cycle
Range
(Measurement
Values)
A, B each cursor value: Measured value of channel
B-A value: Difference between measured values at A/B cursors
Trace
(Time and Mea-
surement Values)
Time Values
A, B each cursor value: Time from trigger point or recording start
B-A value: Time difference between A/B cursors
Measurement Values
A, B each cursor value: (Memory function) measurement value
(Recorder function) maximum, mini-
mum values
B-A value: Difference between measured values at A/B cursors
AB
B-A
B-A
A
B
Time Values
Measurement Values
A
B
B-A
B-A
(Time difference)
(Difference between measured values)
• When Using External Sampling: Value t is the number of samples.
• The data measured with MR8990 Digital Voltmeter Unit is updated at each of
the two movement points of the A and B cursors.
• When the voltage range is changed during measurement by the recorder func-
tion: Trace measurement values are acquired at the range settings when mea-
surement was stopped.
6.1 Reading Measurement Values (Using the A/B Cursors)
123
5
Chapter 6 Waveform Screen Monitoring and Analysis
6
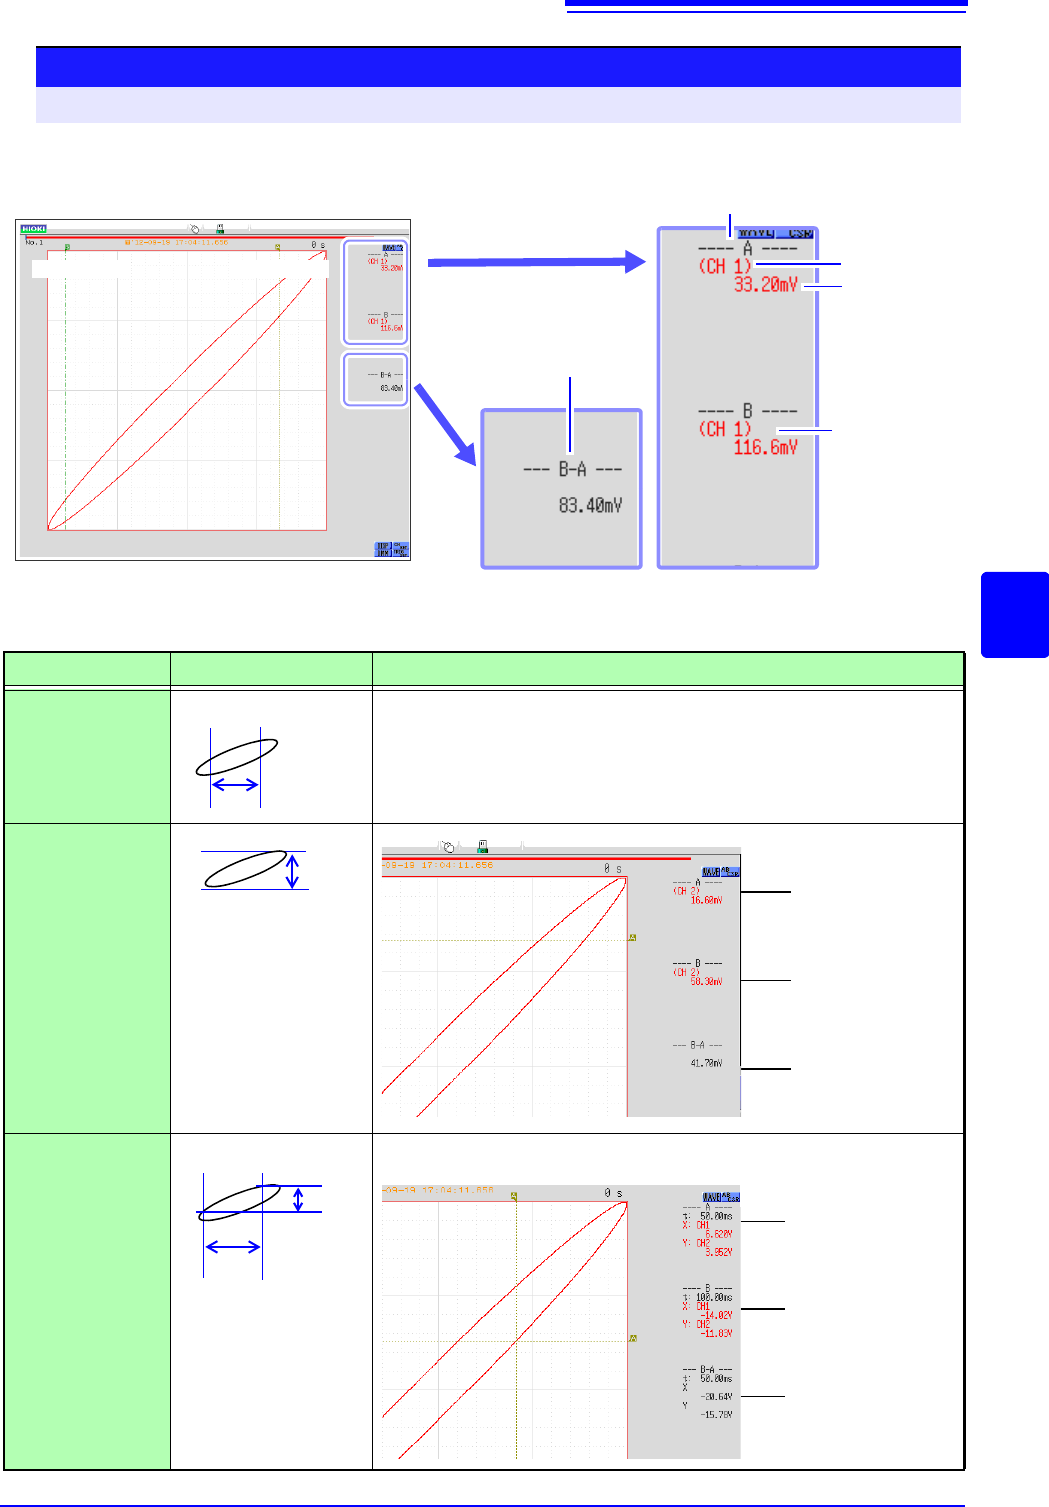
<Screen display (X axis measurement value)>
Reading Measurement Values on Waveform Screen (for X-Y1, 4 screens)
To open the screen: Right-click and select [DISP] Waveform screen
B Cursor A Cursor
X-Y synthesis of channel 1 and channel 2 waveform
Channel
Measure-
ment Value
Cursor A Value
Cursor B
Value
Difference between
measured values at
A/B cursors
<Cursor Value>
Cursor Type
Cursor Value
Cursor Value Display Example (with two cursors)
X
(X axis measure-
ment value)
See "Screen display" above
Y
(Y axis measure-
ment value)
Trace
(Time and X axis,
Y axis measure-
ment value)
AB
B-A
A
B
B-A
Cursor A
measurement
value
Cursor B
measurement
value
Difference
between mea-
sured values at
A/B cursors
(Y axis channels)
A
B
B-A
B-A
(Y axis)
(X axis)
Cursor A time and
measurement value
Cursor B time and
measurement value
Time and measure-
ment value differen-
tial between cursor
A and B
(X axis and Y axis channels)