MR8740、MR8741_user_manual_eng_20191016H.pdf - 第297页
12.8 FFT Analysis Modes 285 11 Chapter 12 FFT Function 12 W aveform Example Coherence Function This function gives a me asure of the correlation (c oherence) between input and output signals. V al- ues obt ained are bet …
12.8 FFT Analysis Modes
284
Waveform Example
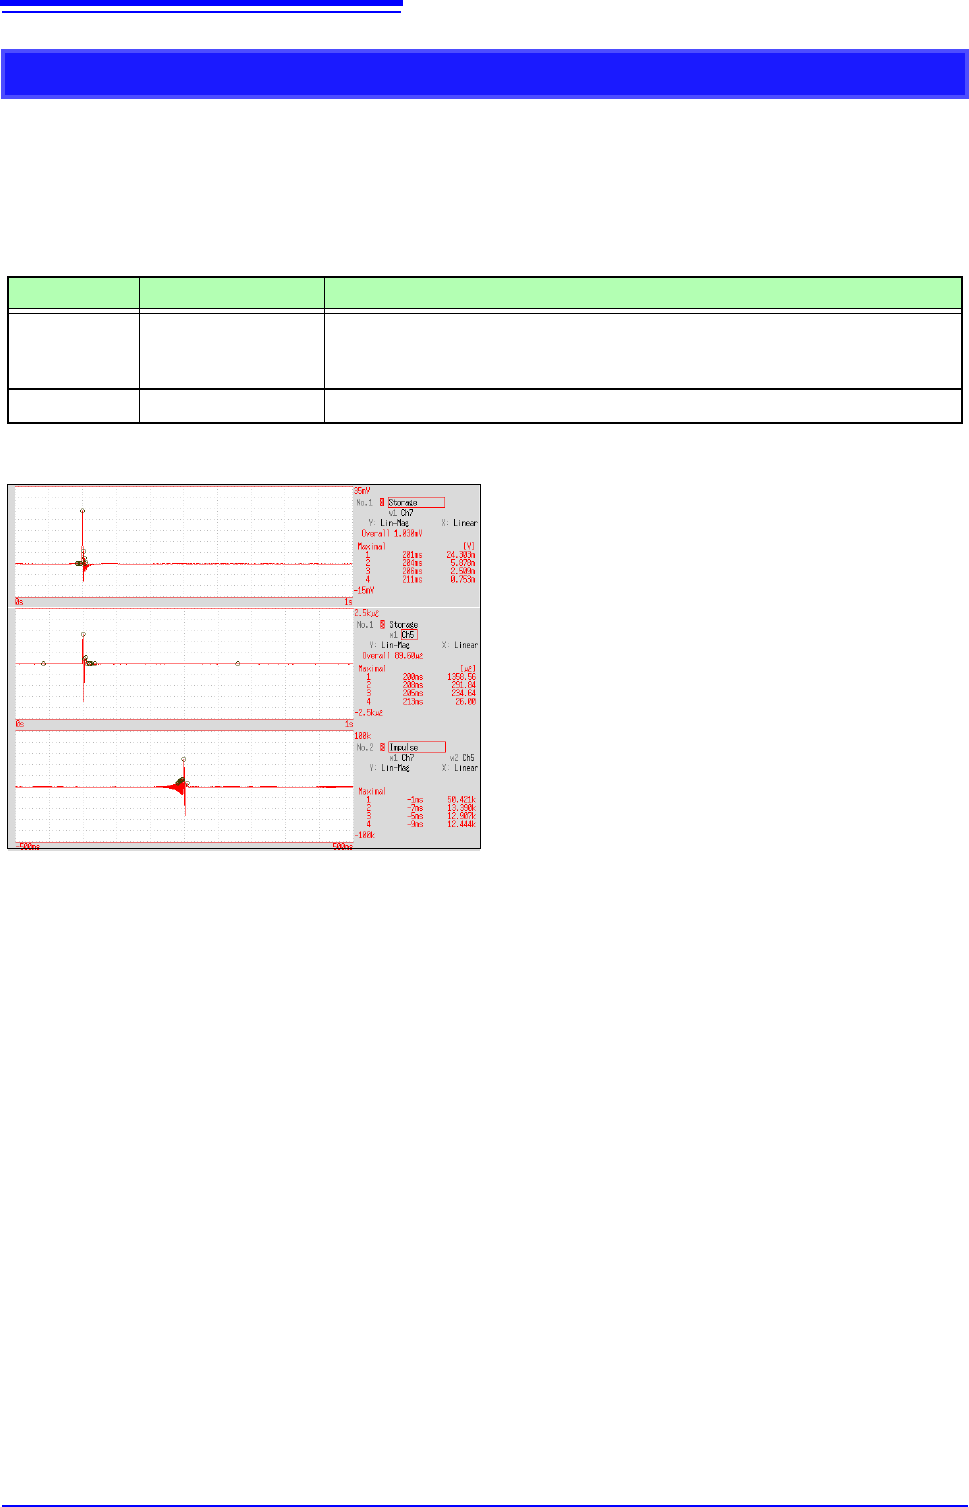
Impulse Response
The transfer characteristic of a system is obtained as a time-domain waveform.
Utilizing both output and input signals of the measurement system, a unit impulse is applied to the
system and the corresponding response waveform is obtained.
Main uses:
To inspect circuit time constants
See: About the Functions"12.8.2 Analysis Mode Functions" (p.293), "Linear Time-Invariant Systems" (p.A14)
Axis Display Type Description
X axis Linear
Time display
The center (t = 0) is the reference. To the right is lag time (+t), and to the left is
lead time (-t)
Y axis Lin-Mag
This value is the transfer function provided by inverse Fourier transformation.
Normal display
X axis: Linear
Y axis: Lin-Mag
Input signal 1
Input signal 2
Impulse response
12.8 FFT Analysis Modes
285
11
Chapter 12 FFT Function
12
Waveform Example
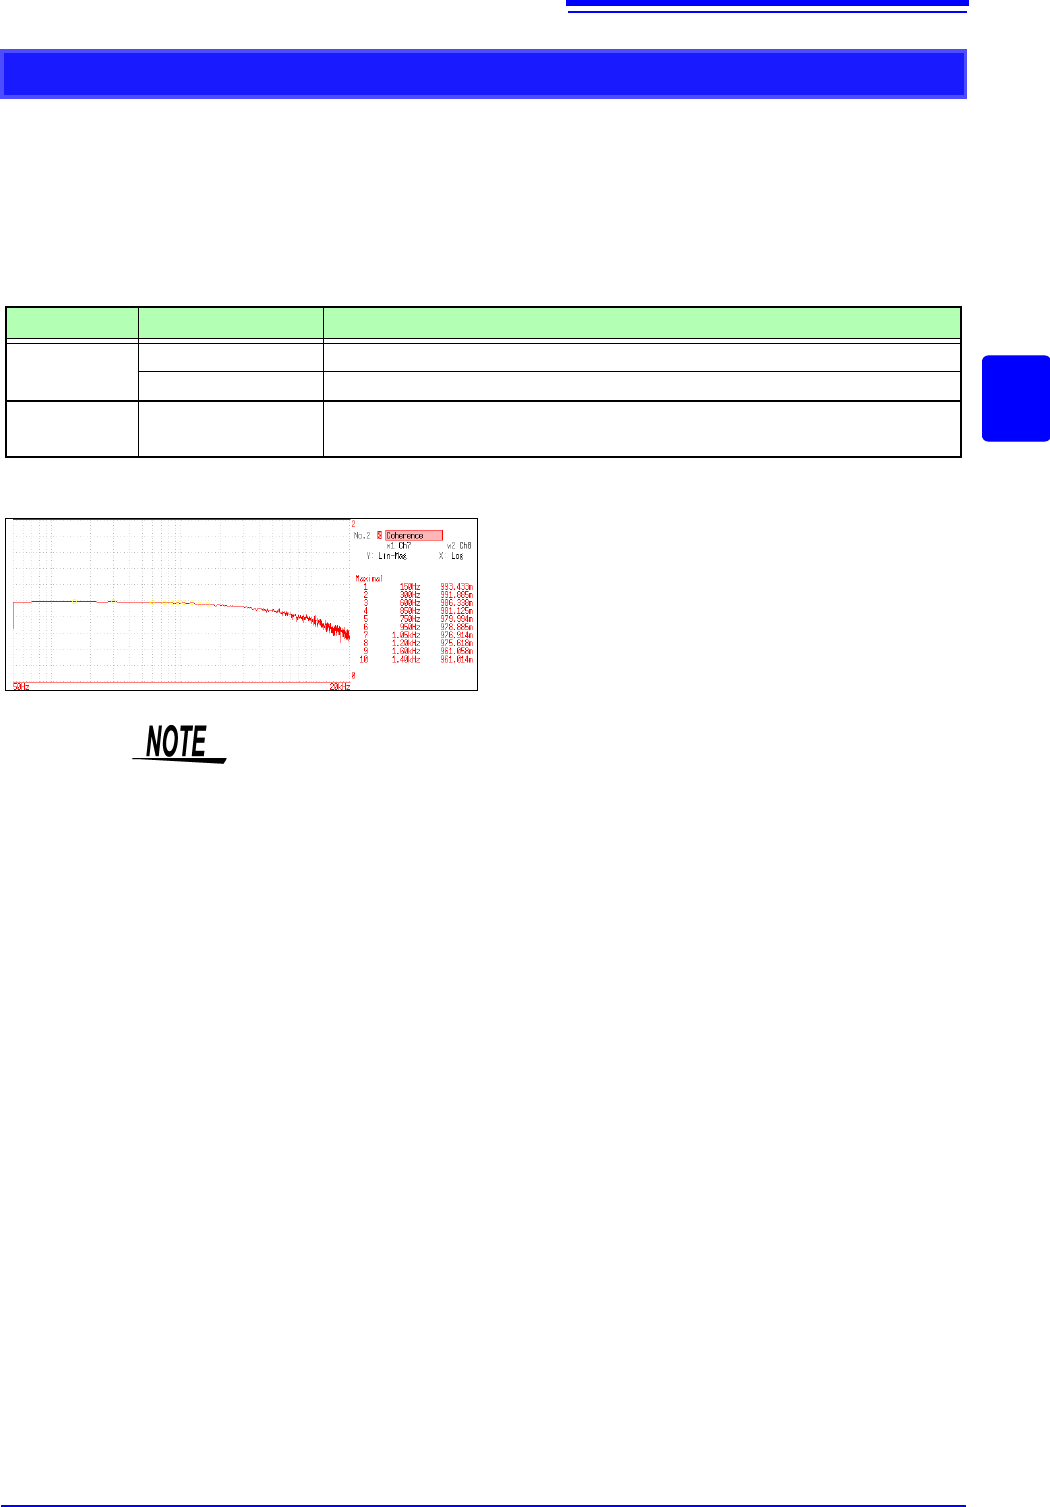
Coherence Function
This function gives a measure of the correlation (coherence) between input and output signals. Val-
ues obtained are between 0 and 1.
Main uses:
• To evaluate transfer functions
• In a system with multiple inputs, to inspect the effect of each input on the output
See: "12.8.2 Analysis Mode Functions" (p.293)
Axis Display Type Description
X axis
Linear Frequency is displayed with equal spacing
Log Frequency display of logarithm interval
Y axis Lin-Mag
Displays the causal relationship and degree of relationship between two input
signals, as a value between 0 and 1 (dimensionless units).
Normal display
X axis: Log
Y axis: Lin-Mag
• With a single measurement, the coherence function gives a value of one for all
frequencies. Spectrum (frequency-domain) averaging should always be per-
formed before measurement (analysis is not available with time-domain aver-
aging).
• The coherence function has two general definition formulas. For the definition
formulas, see"12.8.2 Analysis Mode Functions" (p.293).
12.8 FFT Analysis Modes
286
Waveform Example
Emphasizing only a Specific Portion (Highlighted Display)
A specific portion of a phase spectrum can be emphasized and displayed.
See: "12.3.8 Emphasizing Analysis Results (phase spectra only)" (p.259)
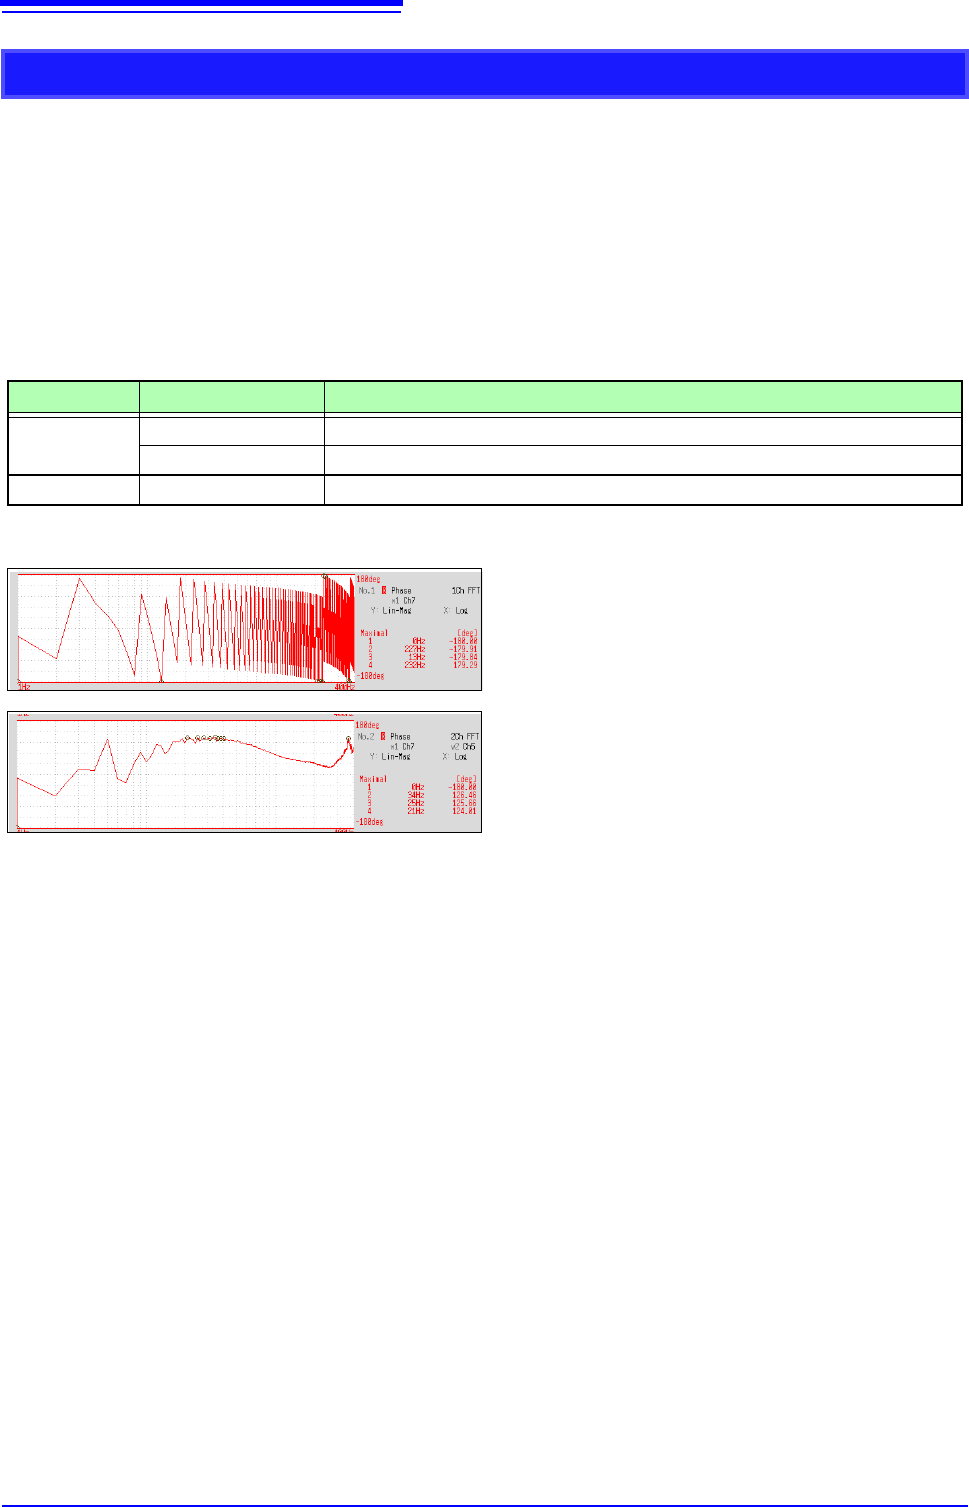
Phase Spectrum
Shows the phase characteristics of the input signal.
Main uses:
• To inspect the phase spectrum of channel 1. Displays the phase of a cosine waveform as a reference (0º).
• To inspect the phase difference between channels 1 and 2.
See: About the Functions"12.8.2 Analysis Mode Functions" (p.293)
1 Ch FFT: Displays the phase of the signal on channel 1. Displays the phase of a cosine waveform as a ref-
erence (0º). Unless the waveform is synchronous, phase values are unstable.
2 Ch FFT: Displays the phase difference between channels 1 and 2. Positive values indicate that the phase
of channel 2 is leading.
Axis Display Type Description
X axis
Linear Frequency is displayed with equal spacing
Log Frequency display of logarithm interval
Y axis Lin-Mag Analysis values are displayed linearly.
1chFFT
X axis: Log
Y axis: Lin-Mag
2chFFT
X axis: Log
Y axis: Lin-Mag