MR8740、MR8741_user_manual_eng_20191016H.pdf - 第275页
12.3 Setting FFT Analysis Conditio ns 263 11 Chapter 12 FFT Function 12 T ot al harmonic distortion (THD) When the analysis mode is one of the following, the curs or appears and the distortion rate is calcu lated. (Lin…
12.3 Setting FFT Analysis Conditions
262
Octave Filter Setting
Filter features are based on JIS C1513-2002 class 1, class 2 (IEC61260).
After determining the entire power spectrum, the instrument performs octave analysis defined by the
above filter characteristics.
See:"Octave Filter Characteristics" (p.A25)
Analysis Modes and X/Y Axis Display
Normal
Filter characteristics approximate those
of an analog filter.
Sharp
Only those spectral component within the
octave band are used for analysis. Spec-
tral components outside of the octave
band are totally ignored.
: Settable, ×: Unsettable
Analysis Mode
X axis Y axis
Nyquist
display
Linear Log Lin-Mag Log-Mag Lin-Real Lin-Imag
OFF
×××××× ×
Storage Waveform
×
××× ×
Histogram
×
××× ×
Linear Spectrum
RMS Spectrum
×
Power Spectrum
×× ×
Power Spectrum Density
×× ×
LPC analysis (Power Spectrum
Density)
×× ×
Transfer Function
Cross Power Spectrum
Impulse Response
×
××× ×
Coherence Function
××× ×
Phase Spectrum
××× ×
Auto-correlation Function
×
××× ×
Cross-correlation Function
×
××× ×
1/1 Octave
×
×× ×
1/3 Octave
×
×× ×
The x/y axes cannot be set when Nyquist Display is selected.

12.3 Setting FFT Analysis Conditions
263
11
Chapter 12 FFT Function
12
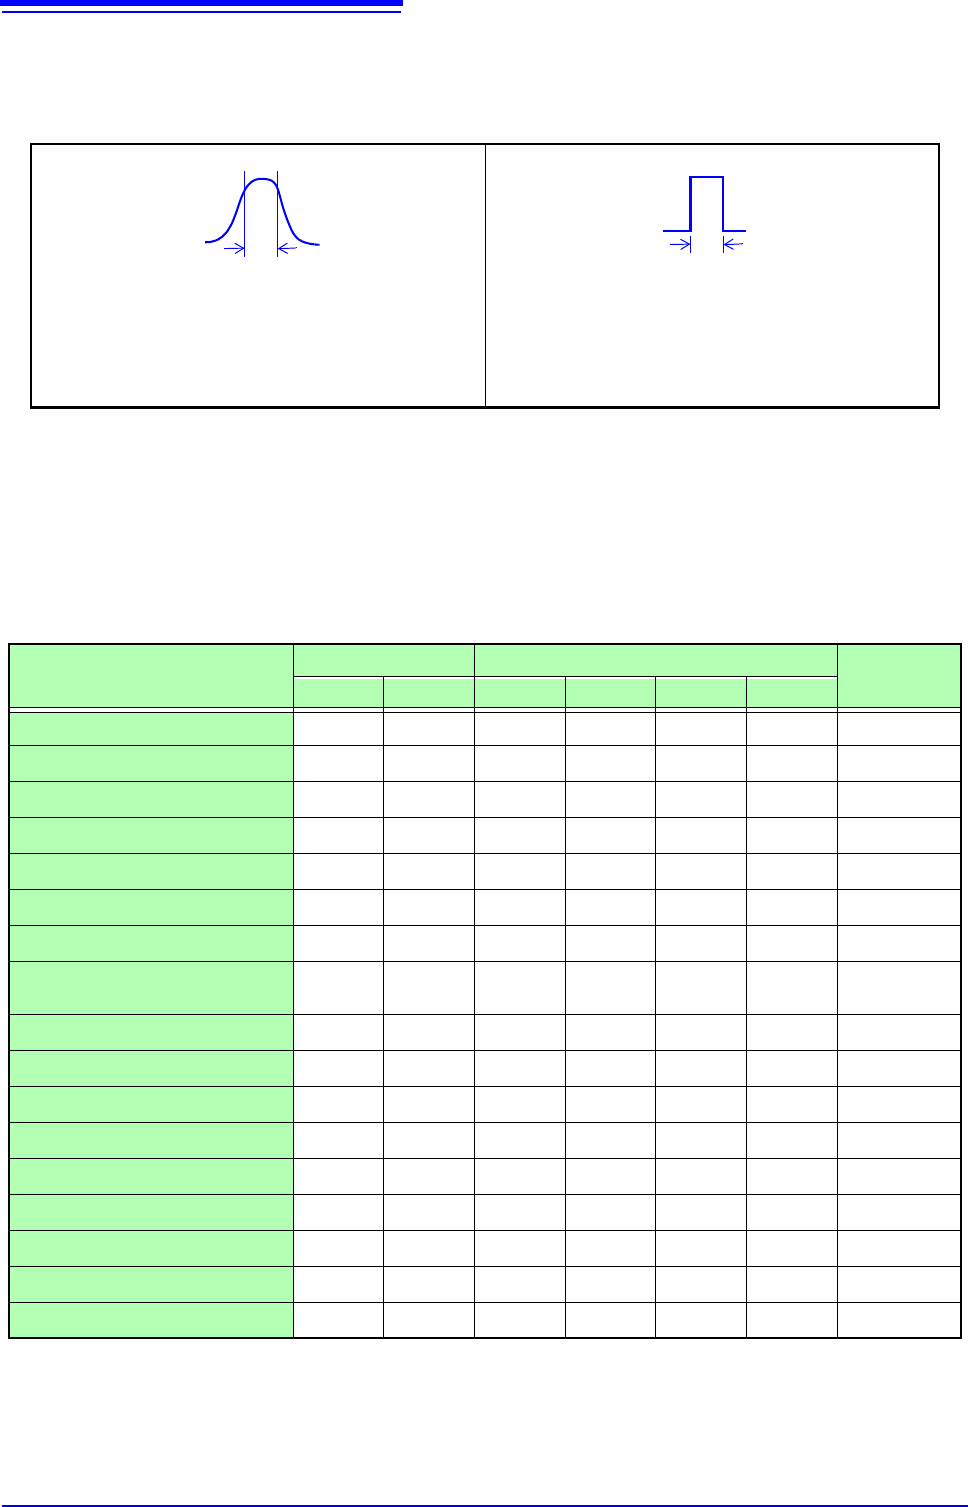
Total harmonic distortion (THD)
When the analysis mode is one of the following, the cursor appears and the distortion rate is calculated.
(Linear spectrum, RMS spectrum, power spectrum)
The distortion rate calculates the cursor position as the fundamental wave. When 2 cursors appear, the A
cursor becomes the fundamental wave.
When calculation results cannot be obtained, [---%] is displayed.
Note that distortion rate values may become higher depending on the window function settings.
THD
f
n
2
f
0
2
---------------
100=
f
0
=fundamental wave
f
n
= n next higher harmonic
[%]
12.3 Setting FFT Analysis Conditions
264
The display range of the vertical (y) axis can be set to automatically suit analysis results, and can be freely
expanded and compressed.
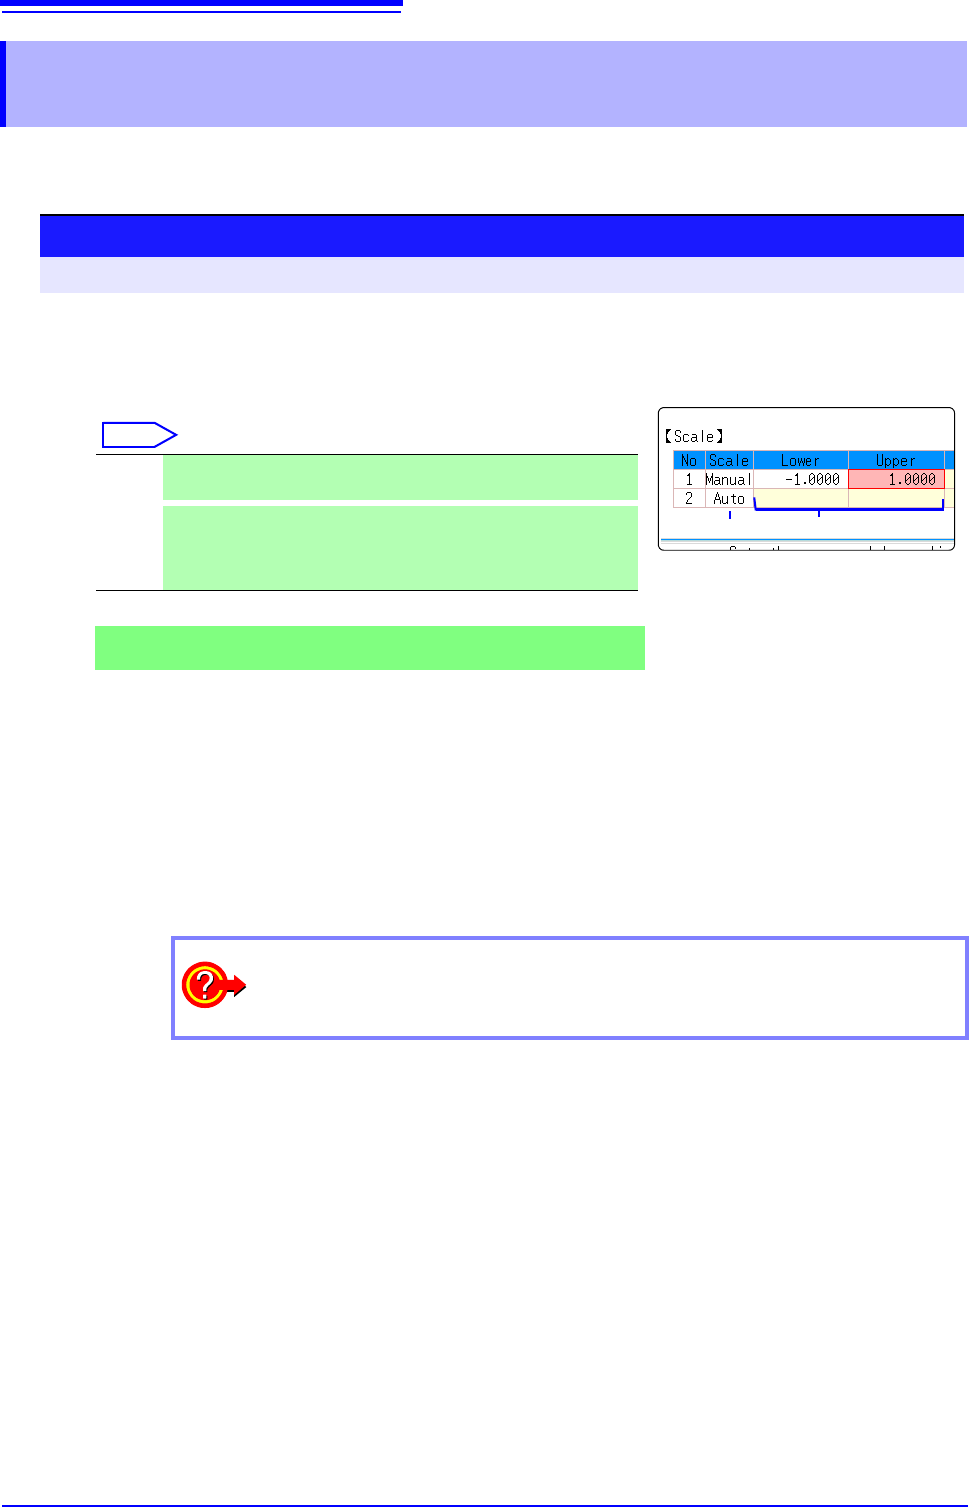
12.3.10Setting the Display Range of the Vertical Axis
(Scaling)
12
1
Select automatic or manual scaling of the y-axis display.
Move the flashing cursor to the [Scale] column of the Analysis No.
to set.
Select
2
When [Manu] is selected
Set the upper and lower limits to display.
Move the flashing cursor to the
[Lower] or [Upper] item.
Set the upper and lower limits to display the analysis results.
Setting range: -9.9999E+29 to +9.9999E+29
(with exponent from E-29 to E+29)
See: "7.1.3 Alphanumeric Input" (p.141)
Auto Scaling of the vertical (y) axis is automatically set according to
analysis results. (default setting)
Manu-
al
Scaling of the vertical (y) axis can be set as desired, to suit the pur-
pose of the measurement.
This is useful for magnifying or reducing the displayed amplitude,
and for shifting the displayed waveform up or down.
Procedure
To open the screen: Right-click and select [STATUS] [Status] sheet
How do I copy settings to other calculation No.?
See: "7.8 Copying settings to other channels (calculation No.) (Copy function)" (p.160)