MR8740、MR8741_user_manual_eng_20191016H.pdf - 第296页
12.8 FFT Analysis Modes 284 W aveform Example Impulse Response The transfer character istic of a system is obt ained as a time-domain wave form. Utilizing both out put and input signals of the measureme nt system, a unit…
12.8 FFT Analysis Modes
283
11
Chapter 12 FFT Function
12
Waveform Example
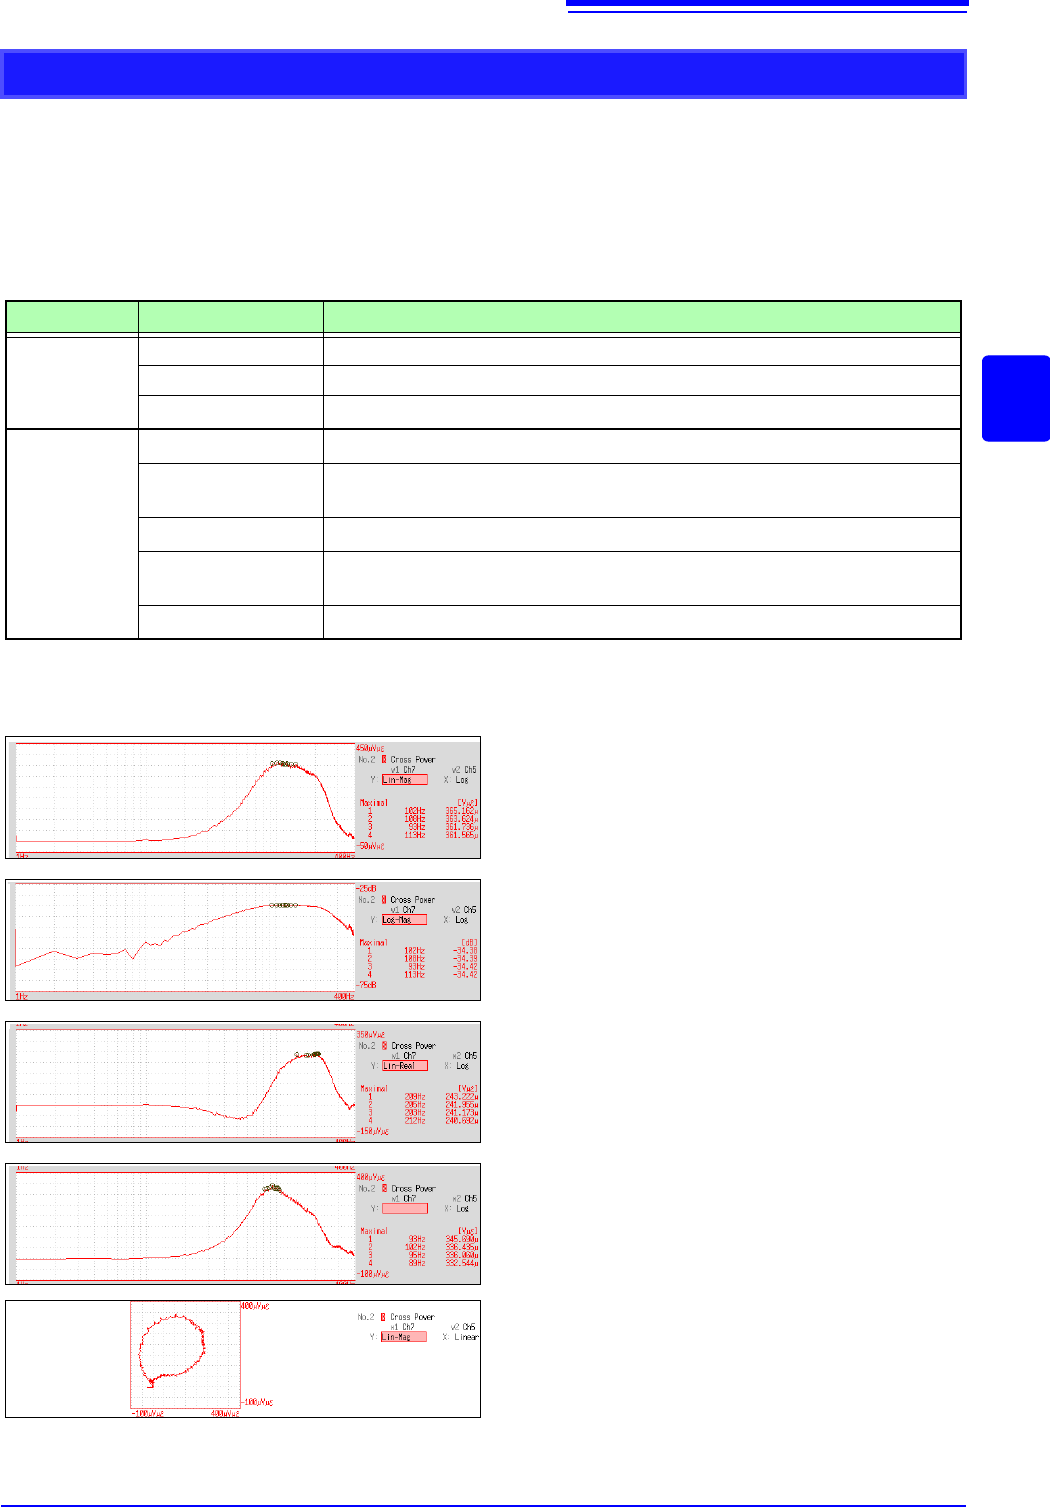
Cross Power Spectrum
The product of the spectra of two input signals can be obtained. The common frequency components
of two signals can be obtained.
Using the voltage and current waveforms as input signals, active power, reactive power and apparent
power can be obtained at each frequency.
Main uses:
To inspect common frequency components of two signals
See: About the Functions"12.8.2 Analysis Mode Functions" (p.293)
Axis Display Type Description
X axis
Linear Frequency is displayed with equal spacing
Log Frequency display of logarithm interval
Nyquist display
Displays the real-number component of the input-output ratio linearly.
Y axis
Lin-Mag
Displays the squared value of amplitude contents of analysis data linearly.
Log-Mag(logarithm)
Displays the amplitude contents of analysis data as dB values. (0 dB reference
value: 1eu
2
)*
Lin-Real
Displays the squared values of the real component of analysis data linearly.
Lin-Imag
Displays the squared values of the imaginary component of analysis data linear-
ly.
Nyquist display
Displays the imaginary component of analysis data linearly.
* eu: engineering units that are currently set are the standard (e.g., when the unit settings is volts, 0 dB = 1 V
2
)
Normal display
X axis: Log
Y axis: Lin-Mag
Normal display
X axis: Log
Y axis: Log-Mag
Normal display
X axis: Log
Y axis: Lin-Real
Normal display
X axis: Log
Y axis: Lin-Imag
Lin-Imag
Nyquist display
12.8 FFT Analysis Modes
284
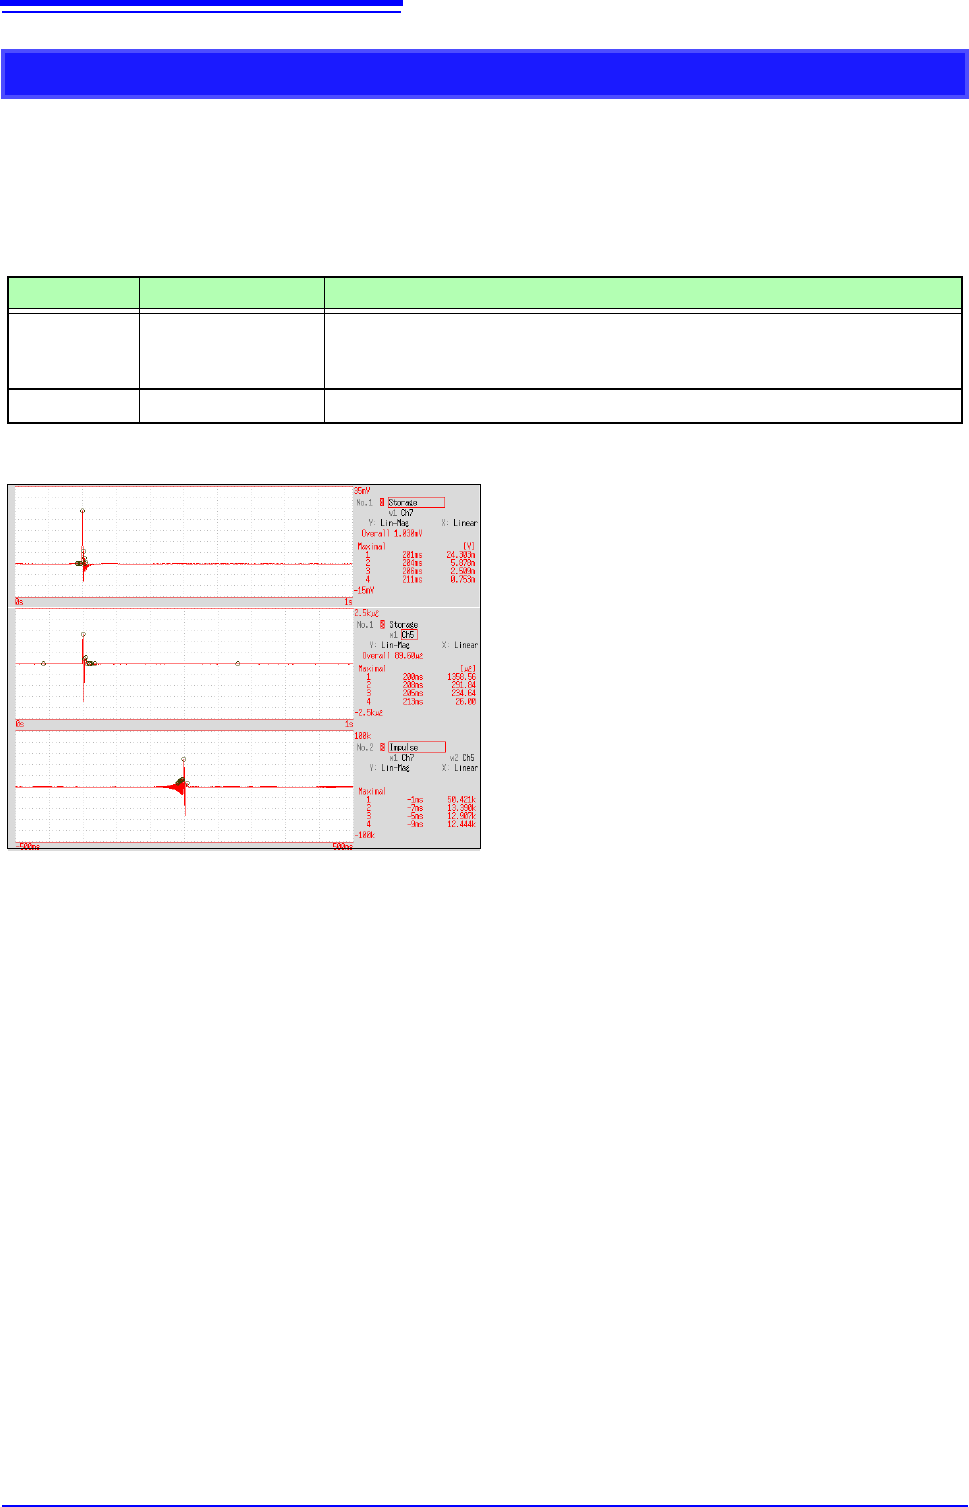
Waveform Example
Impulse Response
The transfer characteristic of a system is obtained as a time-domain waveform.
Utilizing both output and input signals of the measurement system, a unit impulse is applied to the
system and the corresponding response waveform is obtained.
Main uses:
To inspect circuit time constants
See: About the Functions"12.8.2 Analysis Mode Functions" (p.293), "Linear Time-Invariant Systems" (p.A14)
Axis Display Type Description
X axis Linear
Time display
The center (t = 0) is the reference. To the right is lag time (+t), and to the left is
lead time (-t)
Y axis Lin-Mag
This value is the transfer function provided by inverse Fourier transformation.
Normal display
X axis: Linear
Y axis: Lin-Mag
Input signal 1
Input signal 2
Impulse response
12.8 FFT Analysis Modes
285
11
Chapter 12 FFT Function
12
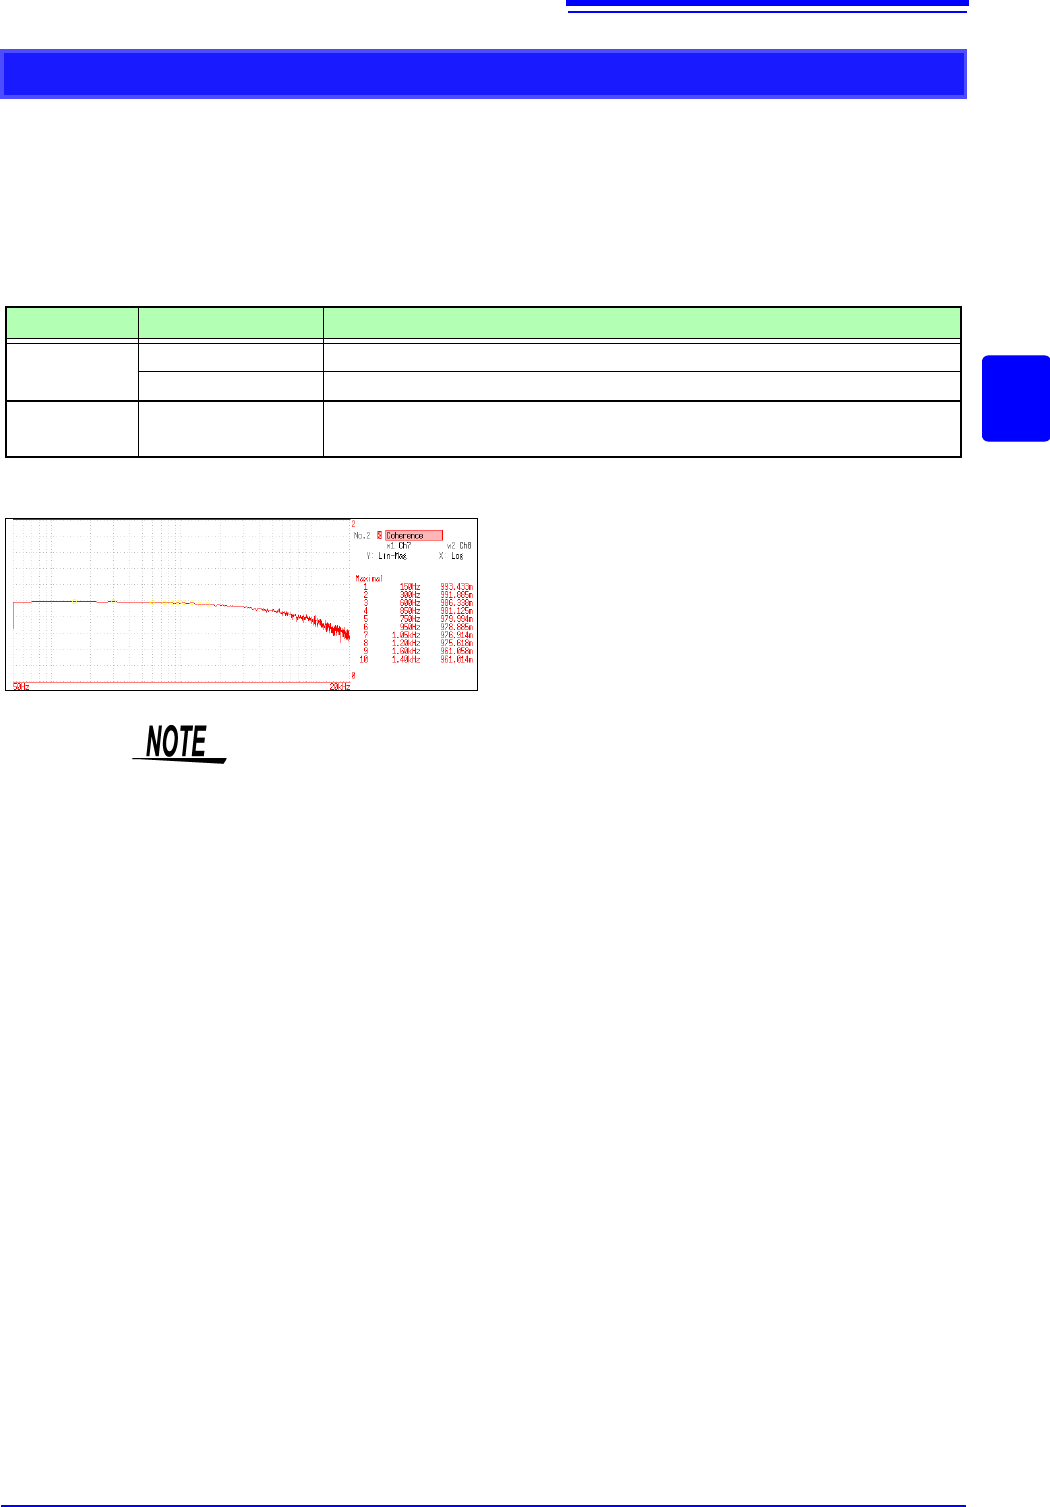
Waveform Example
Coherence Function
This function gives a measure of the correlation (coherence) between input and output signals. Val-
ues obtained are between 0 and 1.
Main uses:
• To evaluate transfer functions
• In a system with multiple inputs, to inspect the effect of each input on the output
See: "12.8.2 Analysis Mode Functions" (p.293)
Axis Display Type Description
X axis
Linear Frequency is displayed with equal spacing
Log Frequency display of logarithm interval
Y axis Lin-Mag
Displays the causal relationship and degree of relationship between two input
signals, as a value between 0 and 1 (dimensionless units).
Normal display
X axis: Log
Y axis: Lin-Mag
• With a single measurement, the coherence function gives a value of one for all
frequencies. Spectrum (frequency-domain) averaging should always be per-
formed before measurement (analysis is not available with time-domain aver-
aging).
• The coherence function has two general definition formulas. For the definition
formulas, see"12.8.2 Analysis Mode Functions" (p.293).