MR8740、MR8741_user_manual_eng_20191016H.pdf - 第264页
12.3 Setting FFT Analysis Conditio ns 252 Relationship Between Frequency Ra nge, Resolution and Number o f Analysis Point s Range [Hz] Sampling frequency [Hz] Timebase [/div] (MEM) Sampling period Number of FFT Analysis …
12.3 Setting FFT Analysis Conditions
251
11
Chapter 12 FFT Function
12
About the frequency range and number of analysis points ___________________
• The settings for the frequency range and number of analysis points determine
the input signal acquisition time and frequency resolution.
• The frequency range setting for the FFT function corresponds to the timebase
setting of the Memory function. Changing the frequency range also changes
the data sampling period.
See: "Relationship Between Frequency Range, Resolution and Number of Analysis
Points" (p.252)
• The cut-off frequency of the anti-aliasing filter is the same as the frequency
range setting.
See: "Relationship Between Frequency Range, Resolution and Number of Analysis
Points" (p.252)
• The set number of analysis points specifies the amount of data to be analyzed
with each measurement. Increasing the number of analysis points increases
the frequency resolution, but also increases the time required for calculations.
See: "Number of Analysis Points" (p.A15)
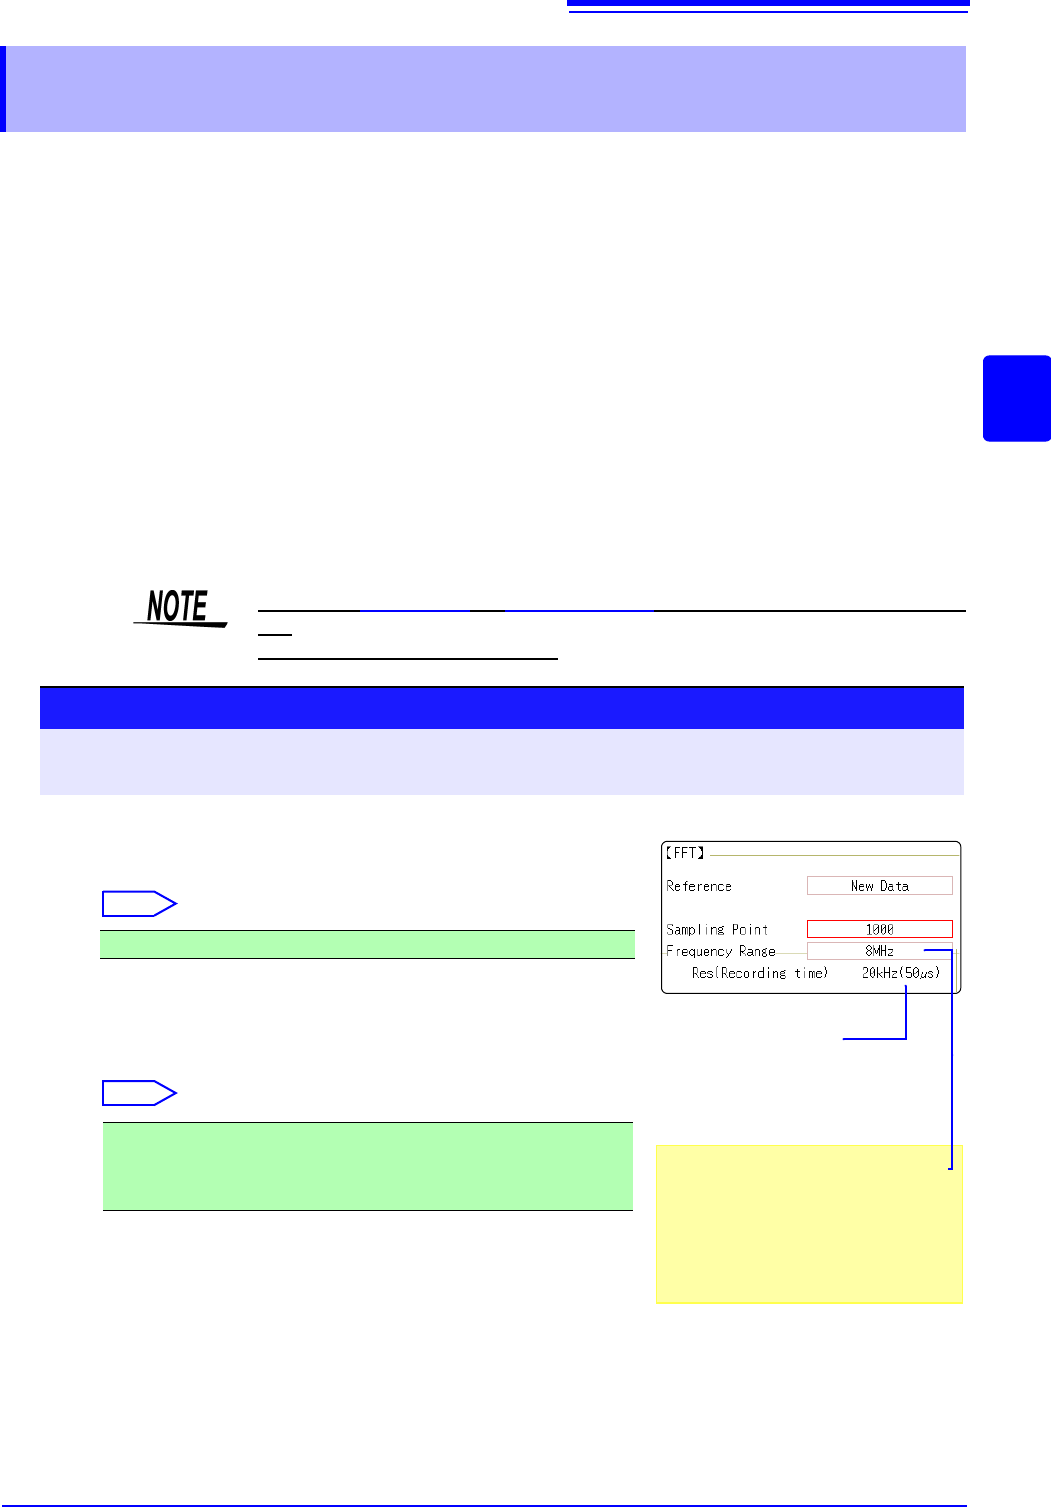
12.3.3 Setting the Frequency Range and Number of
Analysis Points
When the [Reference] is [From Memory], the frequency is automatically
set.
The setting cannot be changed.
To control sampling by an external signal,
select [External]
When the input data [Reference] is
[From Memory]
The frequency range is set automatically
when analysis is started.
1
Set the number of FFT analysis points.
Move the flashing cursor to the [Sampling Point] item.
Select
See: "Number of Analysis Points" (p.A15)
2
Select the frequency range.
Move the flashing cursor to the [Frequency Range] item.
Select
See: "Relationship Between Frequency Range, Resolution and Number of
Analysis Points" (p.252)
1000 (default setting), 2000, 5000, 10000
8 MHz(default setting), 4 MHz, 2 MHz, 800 kHz, 400 kHz, 200 kHz, 80
kHz, 40 kHz, 20 kHz, 8 kHz, 4 kHz , 2 kHz, 800 Hz, 400 Hz, 200 Hz, 80
Hz, 40 Hz, 20 Hz, 8 Hz, 4 Hz, 1.33 Hz, 800 mHz, 667 mHz, 400 mHz, 333
mHz, 133 mHz, External
Procedure
To open the screen: Right-click and select [STATUS] [Status] sheet
See: To set from the Waveform screen (p.265)
Frequency Resolution
(during acquisition)
The resolution is affected by settings of
frequency range and the number of
analysis points. Not displayed for exter-
nal sampling.
2
1
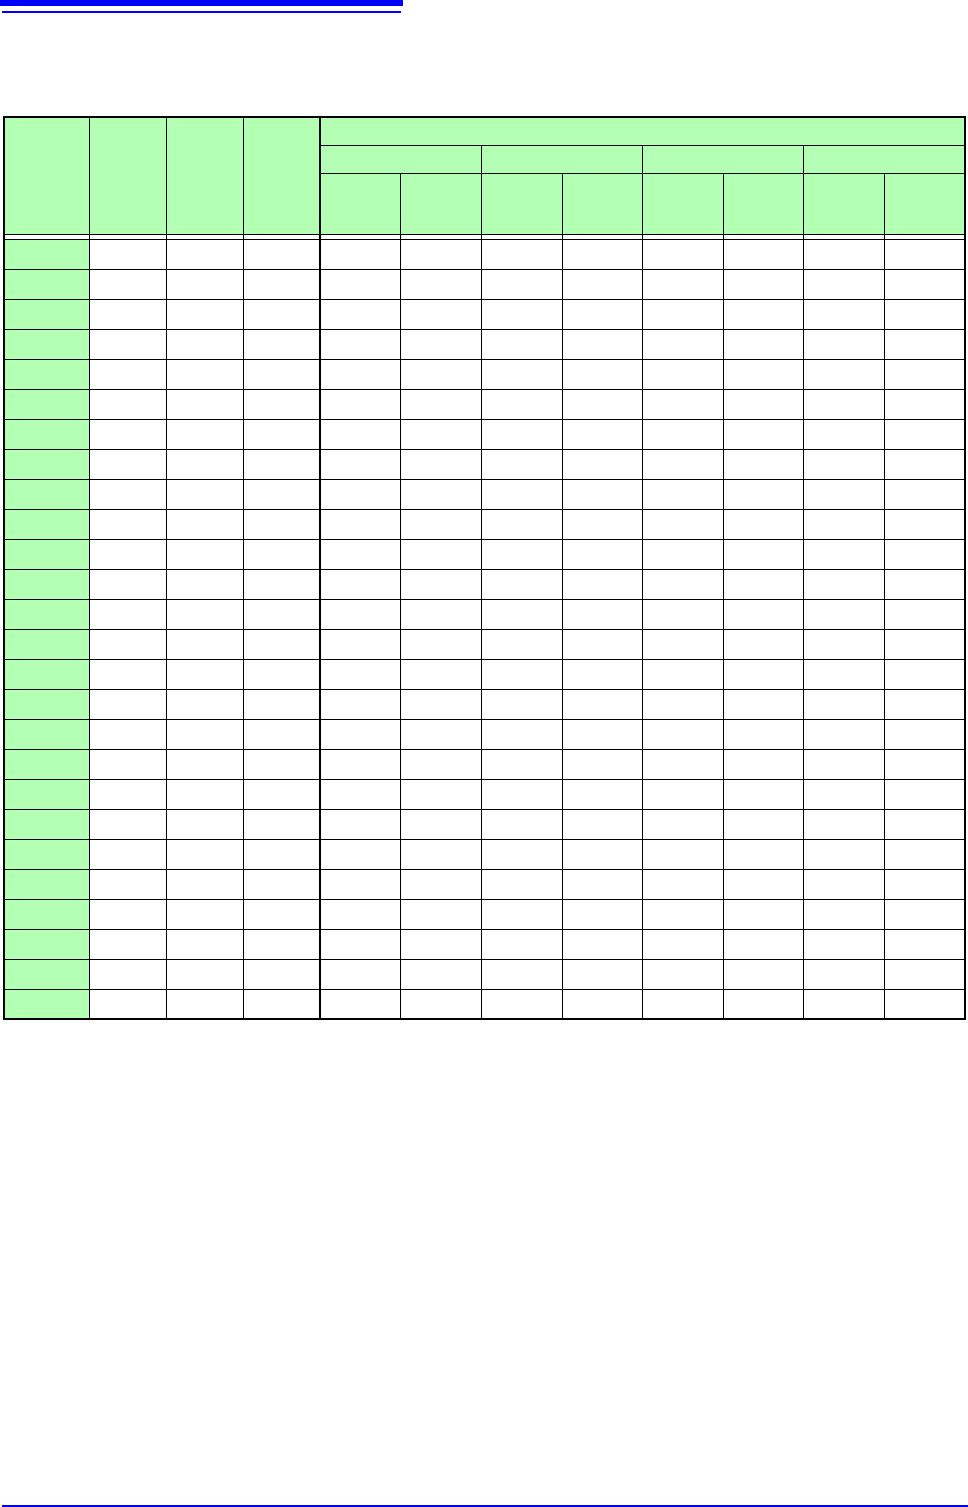
12.3 Setting FFT Analysis Conditions
252
Relationship Between Frequency Range, Resolution and Number of
Analysis Points
Range
[Hz]
Sampling
frequency
[Hz]
Timebase
[/div]
(MEM)
Sampling
period
Number of FFT Analysis Points
1,000 2,000 5,000 10,000
Resolu-
tion [Hz]
Acquisi-
tion
interval
Resolu-
tion [Hz]
Acquisi-
tion
interval
Resolu-
tion [Hz]
Acquisi-
tion
interval
Resolu-
tion [Hz]
Acquisi-
tion
interval
8 M *
1
20 M 5 s 50 ns 20 k 50 s 10 k 100 s 4 k 250 s 2 k 500 s
4 M *
1
10 M 10 s 100 ns 10 k 100 s5 k200 s 2 k 500 s1 k1 ms
2 M *
1
5 M 20 s 200 ns 5 k 200 s 2.5 k 400 s 1 k 1 ms 500 2 ms
800 k *
1
2 M 50 s 500 ns 2 k 500 s 1 k 1 ms 400 2.5 ms 200 5 ms
400 k *
1
1 M 100 s1 s 1 k 1 ms 500 2 ms 200 5 ms 100 10 ms
200 k *
1
500 k 200 s2 s 500 2 ms 250 4 ms 100 10 ms 50 20 ms
80 k *
1
200 k 500 s5 s 200 5 ms 100 10 ms 40 25 ms 20 50 ms
40 k
100 k 1 ms 10
s 100 10 ms 50 20 ms 20 50 ms 10 100 ms
20 k
50 k 2 ms 20
s 50 20 ms 25 50 ms 10 100 ms 5 200 ms
8 k
20 k 5 ms 50
s 20 50 ms 10 100 ms 4 250 ms 2 500 ms
4 k
10 k 10 ms 100
s 10 100 ms 5 200 ms 2 500 ms 1 1 s
2 k
5 k 20 ms 200 s 5 200 ms 2.5 400 ms 1 250 ms 500 m 2 s
800
2 k 50 ms 500 s 2 500 ms 1 1 s 400 m 2.5 s 200 m 5 s
400
1 k 100 ms 1 ms 1 1 s 500 m 2 s 200 m 5 s 100 m 10 s
200
500 200 ms 2 ms 500 m 2 s 250 m 4 s 100 m 10 s 50 m 20 s
80
200 500 ms 5 ms 200 m 5 s 100 m 10 s 40 m 25 s 20 m 50 s
40
100 1 s 10 ms 100 m 10 s 50 m 20 s 20 m 50 s 10 m 100 s
20
50 2 s 20 ms 50 m 20 s 25 m 40 s 10 m 100 s 5 m 200 s
8 *
2
20 5 s 50 ms 20 m 50 s 10 m 100 s 4 m 250 s 2 m 500s
4 *
2
10 10 s 100 ms 10 m 100 s 5 m 200s 2 m 500 s 1 m 1 ks
1.33 *
2
3.33 30 s 300 ms 3.33 m 300 s 1.66 m 600s 666 1.5 ks 333 3 ks
800 m *
2
2 50 s 500 ms 2 m 500 s 1 m 1 ks 400 2.5 ks 200 5 ks
667 m *
2
1.67 60 s 600 ms 1.66 m 600 s 833 1.2 ks 333 3 ks 166 6 ks
400 m *
2
1 100 s 1 s 1 m 1 ks 500 2 ks 200 5 ks 100 10 ks
333 m *
2
833 m 120 s 1.2 s 833 1.2 ks 416 2.4 ks 166 6 ks 83.3 12 ks
133 m *
2
333 m 300 s 3 s 333 3 ks 166 6 ks 66.6 15 ks 33.3 30 ks
The cut-off frequency of the anti-aliasing filter is the same as the frequency range.
*1. The anti-aliasing filter is turned off.
*2. Cut-off frequency is 20 Hz.
12.3 Setting FFT Analysis Conditions
253
11
Chapter 12 FFT Function
12
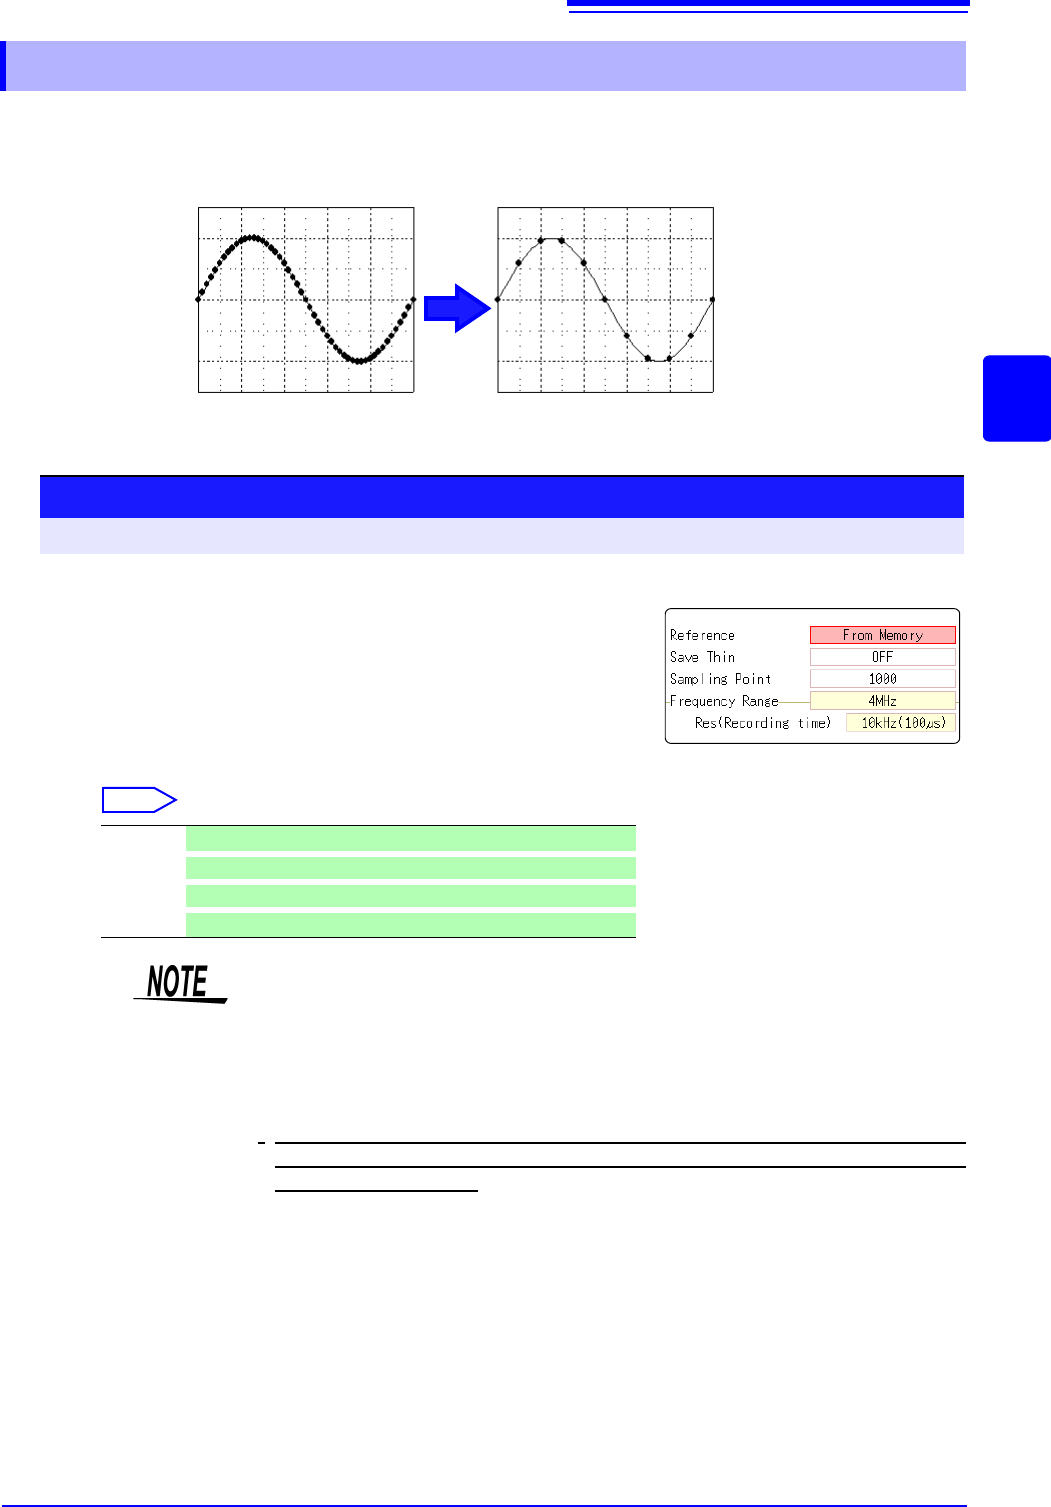
When performing FFT analysis of data measured using the memory function, the measurement
data can be thinned before calculation. If the sampling frequency is too high and the expected
results are not obtained, thin the data before calculation to increase the frequency resolution.
12.3.4 Thinning Out and Calculating Data
Original waveform Thinned waveform
1
Select the reference data.
Move the flashing cursor to the [Reference] item, and select
[From Memory].
2
Select the thinning amount.
Move the flashing cursor to the [Save Thin] item.
Select
Off Do not thin out.. (default setting)
1/10
Skip every 10 data points.
1/100
Skip every 100 data points.
1/1000
Skip every 1000 data points.
Procedure
To open the screen: Right-click and select [STATUS] [Status] sheet
1
2
• The [Save Thin] setting can only be set when the [Reference] is set to [From
Memory].
• The range that can be set for thinning changes depending on the time axis
range measured by the memory function.
• The frequency range is automatically determined. This setting cannot be
changed.
•
When thinning, aliasing occurs and waveforms that did not originally exist may
be observed. Make settings after sufficient consideration of the frequencies
included in waveforms.