MR8740、MR8741_user_manual_eng_20191016H.pdf - 第295页
12.8 FFT Analysis Modes 283 11 Chapter 12 FFT Function 12 W aveform Example Cross Power Spectrum The product of the s pectra of two input signals can be obt ained. The common frequenc y component s of two signals can be …
12.8 FFT Analysis Modes
282
Waveform Example
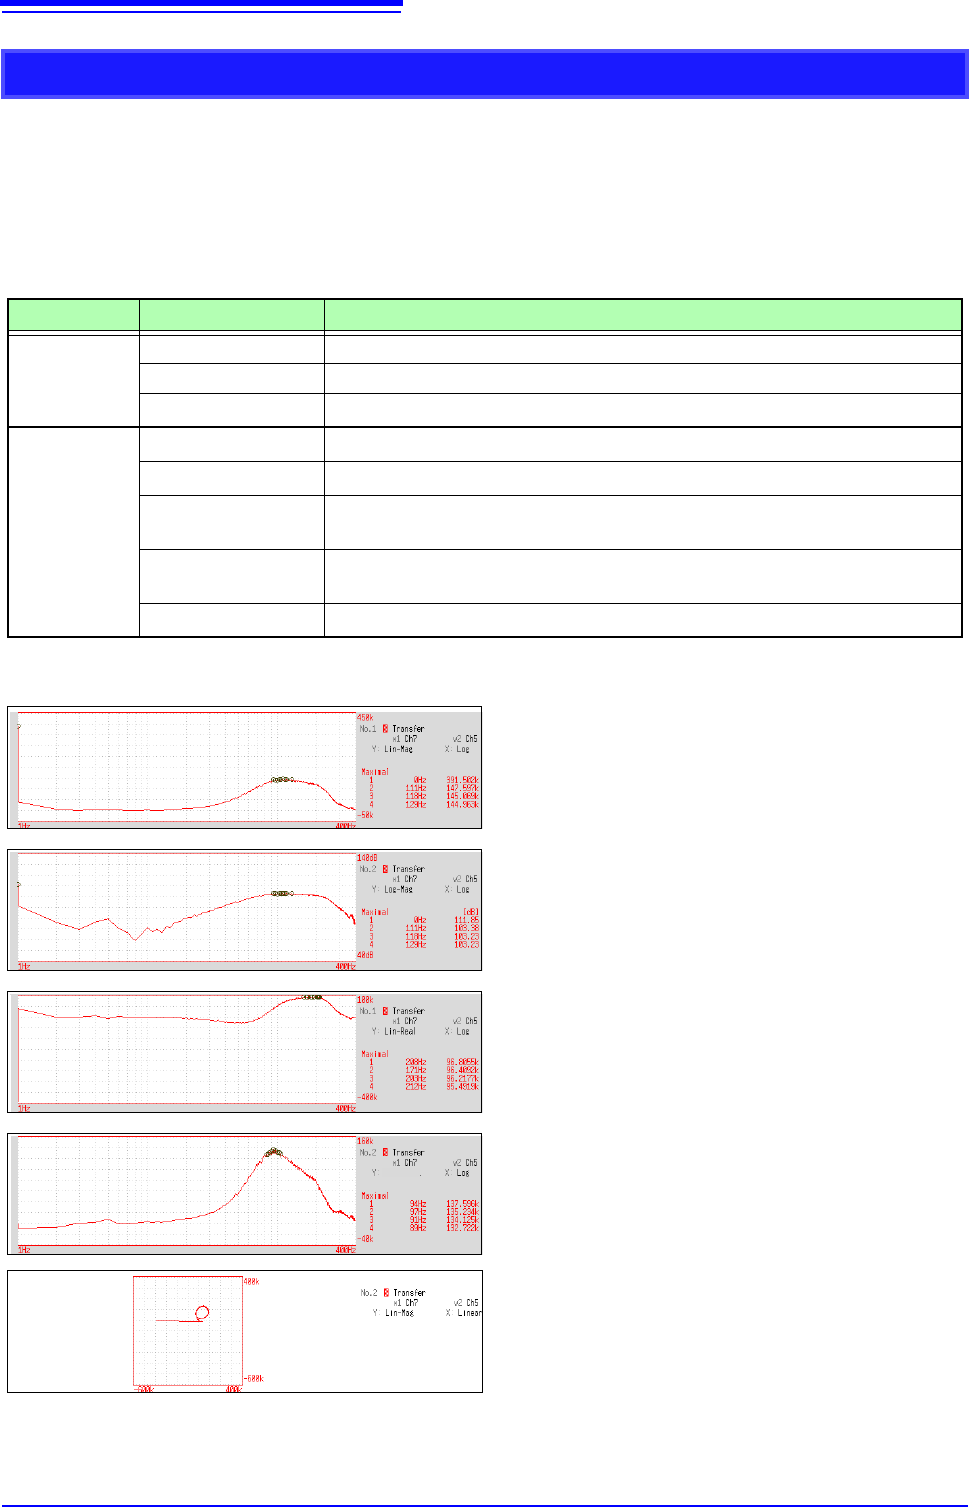
Transfer Function
From the input and output signals, the transfer function (frequency characteristic) of a measurement
system can be obtained. It can also be displayed as a Nyquist plot.
Main uses:
• To inspect a filter’s frequency characteristic
• To inspect the stability of a feedback control system (using the Nyquist plot)
• To inspect the resonance characteristic of an object using an impulse hammer and pick-up sensor
See: About the Functions"12.8.2 Analysis Mode Functions" (p.293), "Linear Time-Invariant Systems" (p.A14)
Axis Display Type Description
X axis
Linear Frequency is displayed with equal spacing
Log Frequency display of logarithm interval
Nyquist display
Displays the real-number component of the input-output ratio.
Y axis
Lin-Mag
Displays the input-output ratio linearly (dimensionless units).
Log-Mag(logarithm)
Displays the input-output ratio as dB values.
Lin-Real
Displays the real-number component of the input-output ratio (dimensionless
units).
Lin-Imag
Displays the imaginary component of the input-output ratio (dimensionless
units).
Nyquist display
Displays the imaginary component of the input-output ratio.
Normal display
X axis: Log
Y axis: Lin-Mag
Normal display
X axis: Log
Y axis: Log-Mag
Normal display
X axis: Log
Y axis: Lin-Real
Normal display
X axis: Log
Y axis: Lin-Imag
Lin-Imag
Nyquist display
12.8 FFT Analysis Modes
283
11
Chapter 12 FFT Function
12
Waveform Example
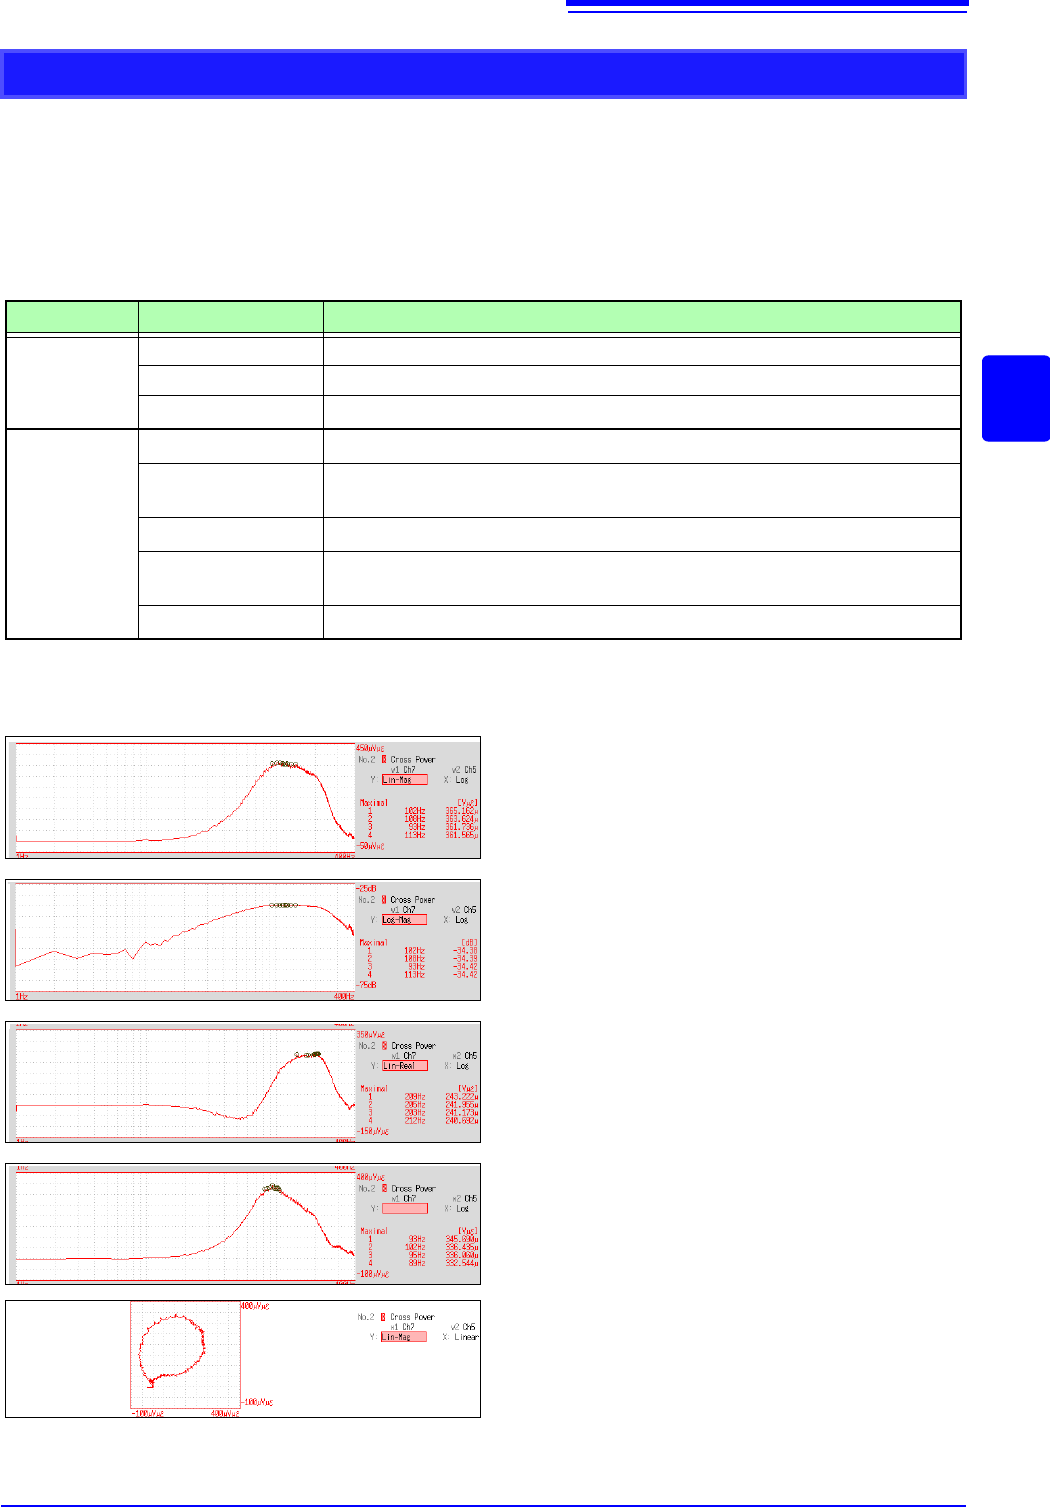
Cross Power Spectrum
The product of the spectra of two input signals can be obtained. The common frequency components
of two signals can be obtained.
Using the voltage and current waveforms as input signals, active power, reactive power and apparent
power can be obtained at each frequency.
Main uses:
To inspect common frequency components of two signals
See: About the Functions"12.8.2 Analysis Mode Functions" (p.293)
Axis Display Type Description
X axis
Linear Frequency is displayed with equal spacing
Log Frequency display of logarithm interval
Nyquist display
Displays the real-number component of the input-output ratio linearly.
Y axis
Lin-Mag
Displays the squared value of amplitude contents of analysis data linearly.
Log-Mag(logarithm)
Displays the amplitude contents of analysis data as dB values. (0 dB reference
value: 1eu
2
)*
Lin-Real
Displays the squared values of the real component of analysis data linearly.
Lin-Imag
Displays the squared values of the imaginary component of analysis data linear-
ly.
Nyquist display
Displays the imaginary component of analysis data linearly.
* eu: engineering units that are currently set are the standard (e.g., when the unit settings is volts, 0 dB = 1 V
2
)
Normal display
X axis: Log
Y axis: Lin-Mag
Normal display
X axis: Log
Y axis: Log-Mag
Normal display
X axis: Log
Y axis: Lin-Real
Normal display
X axis: Log
Y axis: Lin-Imag
Lin-Imag
Nyquist display
12.8 FFT Analysis Modes
284
Waveform Example
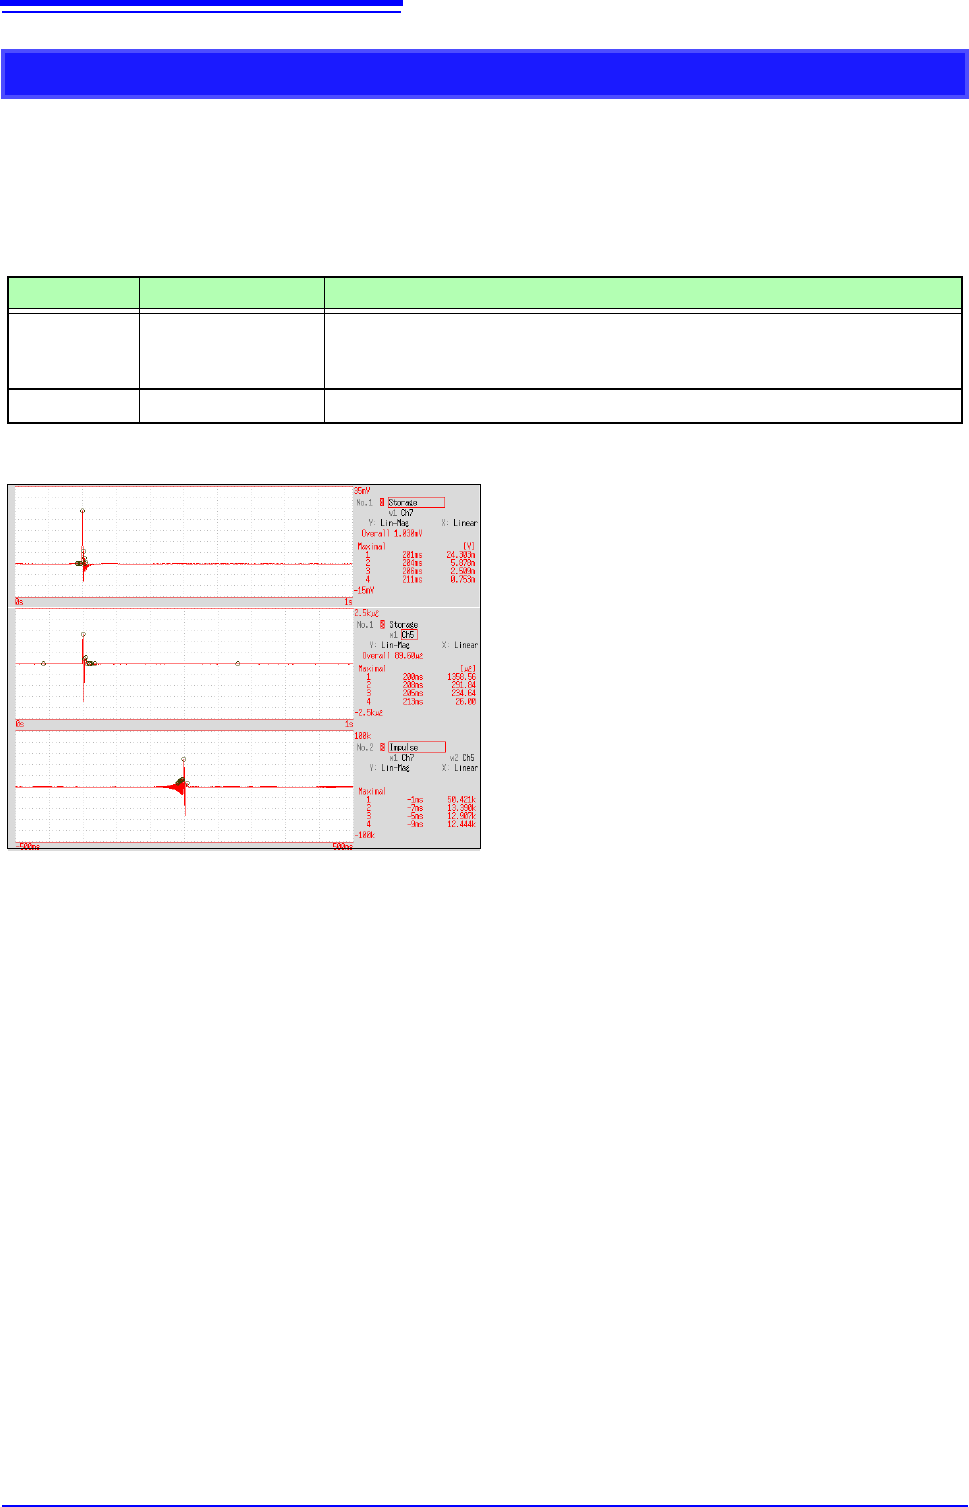
Impulse Response
The transfer characteristic of a system is obtained as a time-domain waveform.
Utilizing both output and input signals of the measurement system, a unit impulse is applied to the
system and the corresponding response waveform is obtained.
Main uses:
To inspect circuit time constants
See: About the Functions"12.8.2 Analysis Mode Functions" (p.293), "Linear Time-Invariant Systems" (p.A14)
Axis Display Type Description
X axis Linear
Time display
The center (t = 0) is the reference. To the right is lag time (+t), and to the left is
lead time (-t)
Y axis Lin-Mag
This value is the transfer function provided by inverse Fourier transformation.
Normal display
X axis: Linear
Y axis: Lin-Mag
Input signal 1
Input signal 2
Impulse response