MR8740、MR8741_user_manual_eng_20191016H.pdf - 第279页
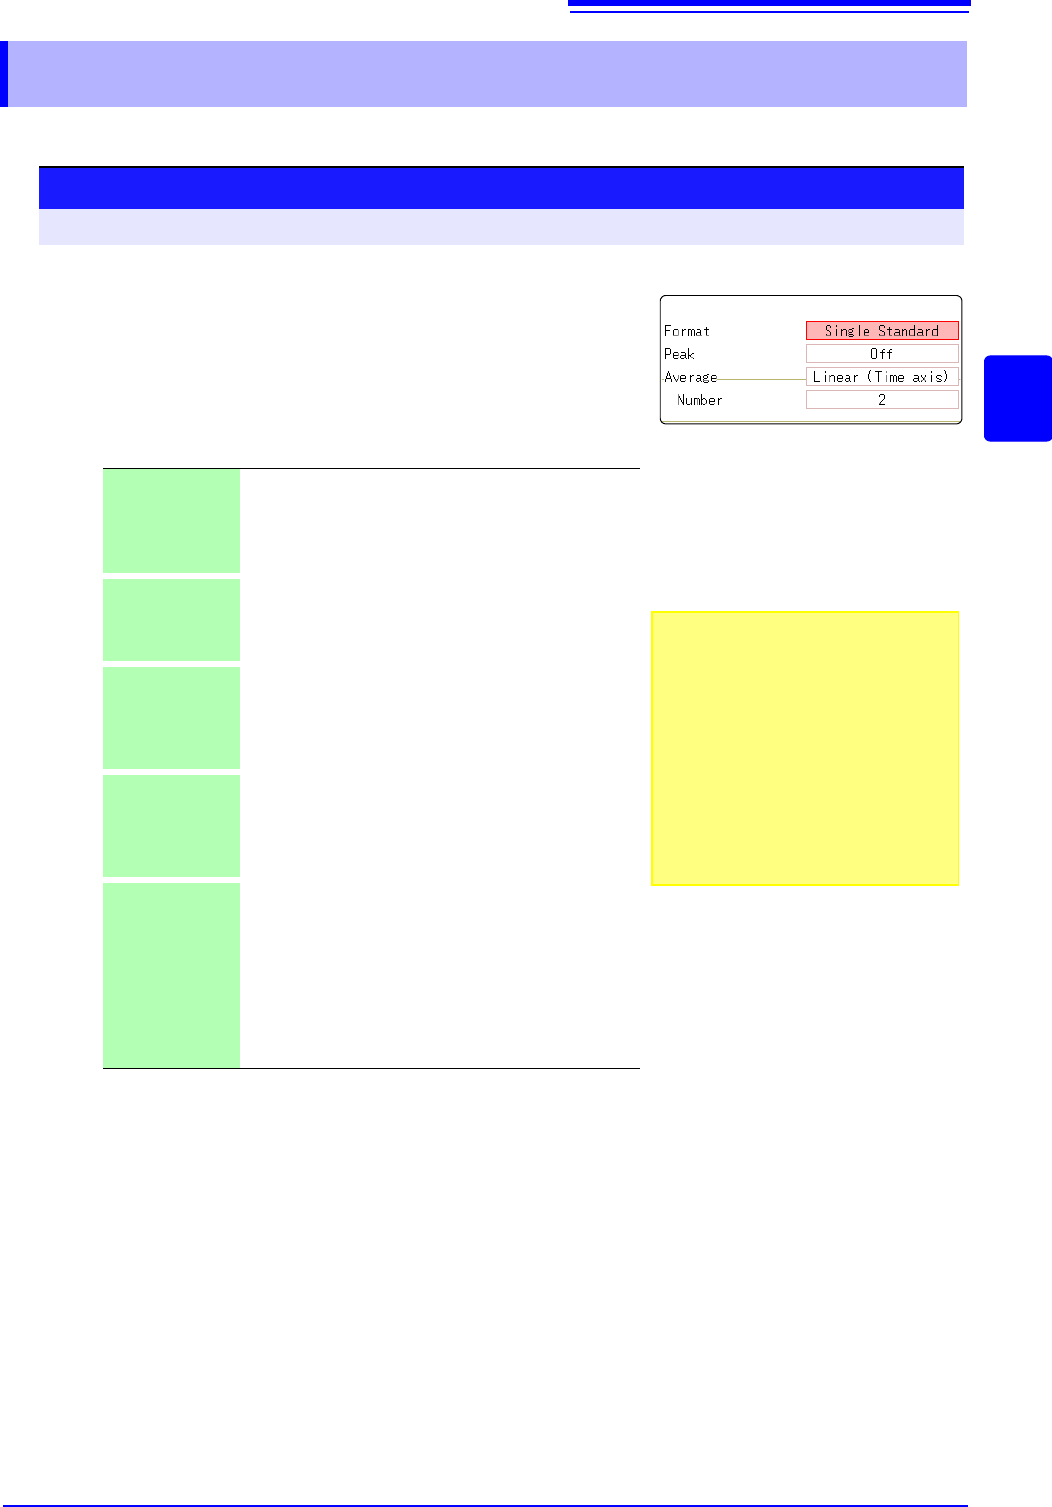
12.5 Setting Screen Displays 267 11 Chapter 12 FFT Function 12 Set the display method for FFT calculation results. 12.5 Setting Screen Displays 1 Select the display format. Move the flashing cursor to the [Format] item. …
12.4 Selecting Channels
266
Channel selection is the same for all functions.
For the setting method, refer to "3.5 Input Channel Setting" (p.73) and "7.9 Setting Details of Mod-
ules" (p.161).
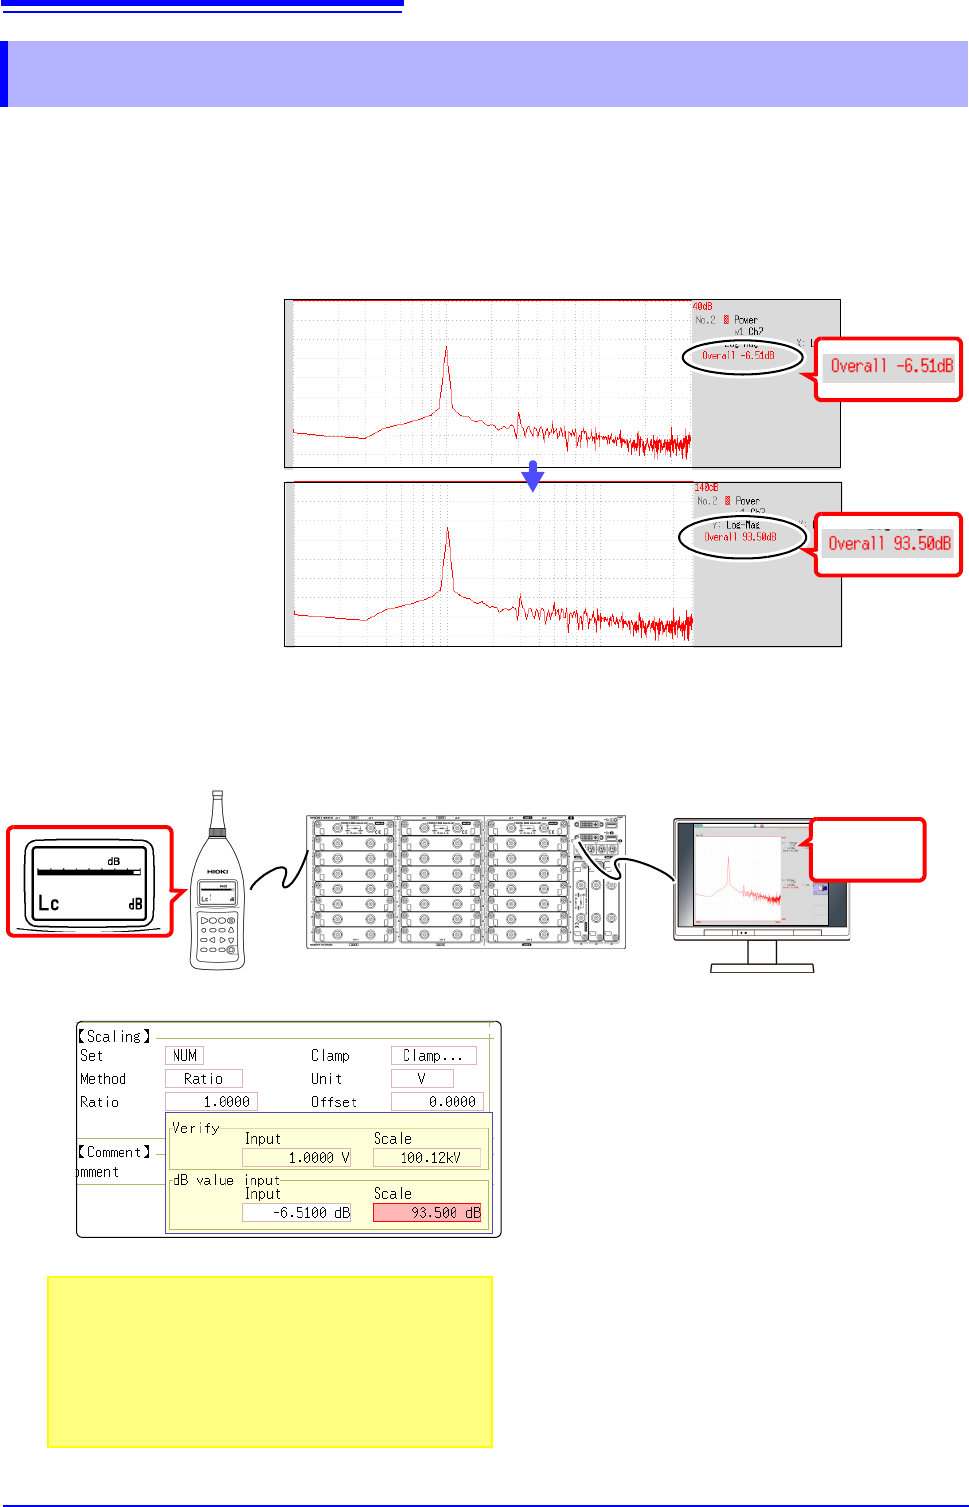
Scaling
The scaling setting allows values displayed on this instrument to match the actual values read directly on
a sound level meter or vibration meter.
Setting example: To display measurement data on this instrument so that it corresponds
to that on a sound level meter.
In a case where a sound level meter displays 93.5 dB and the overall value displayed on the Wave-
form screen of this instrument is -6-51 dB.
12.4 Selecting Channels
Without Scaling
With Scaling
54
1
2
3
Sound Level Meter
93.5
93.5
1 Select [Num].
2 Select [Ratio].
3 Move the flashing cursor to [Ratio], and
click [dB Scaling].
The dB Scaling dialog appears.
4 Enter the (overall) value “-6.51” displayed
on the instrument.
5 Enter the value "93.5" (from the sound
level meter) that you want to read
directly.
6 Click [Confirm] to perform scaling.
Scaling is performed automatically and the con-
version value is set in the conversion rate column.
See: "Overall Value" (p.A19)
0 dB reference differs depends on the physical quantity.
As an example for sound pressure, 20 Pa is 0 dB.
In dB scaling, the dB value can be directly read; howev-
er, it may not be possible to directly read instantaneous
values.
Read the written standards and other materials regard-
ing 0 dB references.
93.5
93.5
93.5
Overall:
-6.51dB
12.5 Setting Screen Displays
267
11
Chapter 12 FFT Function
12
Set the display method for FFT calculation results.
12.5 Setting Screen Displays
1
Select the display format.
Move the flashing cursor to the [Format] item.
Select the format of data to be displayed.
The display format depends on the input data selected for analysis.
*: The horizontal axis and vertical axis display the real parts and the
imaginary parts of calculation results, respectively.
2
Click [DISP] in the right-click menu to display the Wave-
form screen.
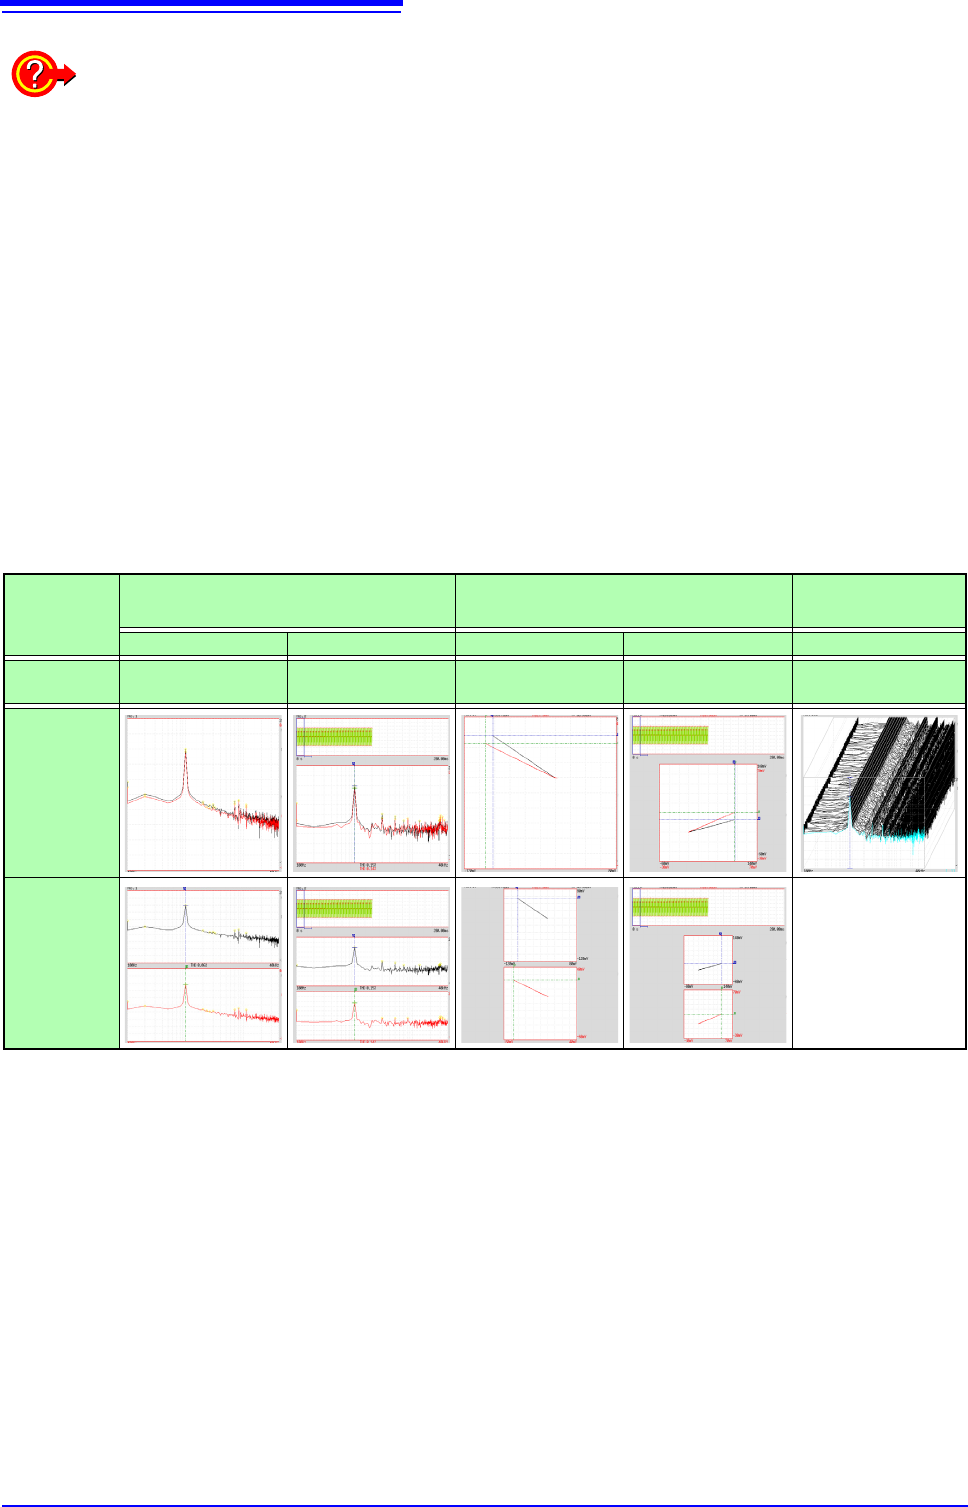
Single
Standard
The FFT calculation results are displayed in one screen.
If the calculations have multiple settings, waveforms are
overlaid.
Note: Depending on the analysis mode settings, analy-
sis No1 only may be preferentially displayed.
Dual Standard The FFT calculation results are displayed in two
screens.
If the calculations have multiple settings, waveforms are
displayed for each specified calculation.
Single Nyquist
*
If the analysis mode is linear spectrum, transfer function
or cross power spectrum, the FFT calculation result is
displayed in Nyquist display on one screen.
If the calculations have multiple settings, waveforms are
overlaid.
Dual Nyquist
*
If the analysis mode is linear spectrum, transfer function
or cross power spectrum, the FFT calculation result is
displayed in Nyquist display on two screens.
If the calculations have multiple settings, waveforms are
displayed for each specified calculation.
Running
spectrum
If the analysis mode is one of the following, analysis re-
sults are displayed three-dimensions: frequency, oscil-
lation and time.
(Linear spectrum, RMS spectrum, power spectrum,
power spectrum density, LPC analysis, transfer func-
tion, cross power spectrum, 1/1 octave analysis, 1/3 oc-
tave analysis)
If the calculations have multiple settings, No1 is prefer-
entially displayed.
Procedure
To open the screen: Right-click and select [STATUS] [Status] sheet
To use an existing memory waveform
for analysis
Select [From Memory]as the input data
source [Reference].
See: "12.3.2 Selecting the Data Source
for Analysis" (p.250)
To specify the analysis starting point
Specify the starting point on the memory
waveform.
See: "12.7.1 Analyzing after Specifying an
Analysis Starting Point" (p.273)
1
12.5 Setting Screen Displays
268
Display Types and Split-Screen Settings
Nine display arrangements are available.
When “Drawing failed”:
•
NG: Nyquist, Running Spectrum
The display format settings and analysis mode do not match.
•
NG: X-Axis
Either change the [Format] setting and increase the number of screen divisions or change the
display setting of the X-axis.
Linear and logarithm X-axes cannot exist in one graph.
•
NG:X-unit
Set [Format] and increase the number of screen divisions. Different horizontal axis units cannot
coexist in 1 graph.
•
NG: EXT
Analysis mode cannot perform external sampling.
Standard Nyquist
Running
Spectrum
Single Standard Dual Standard Single Nyquist Dual Nyquist Running spectrum
[Reference]
setting
[New Data] [From Memory] [New Data] [From Memory] [New Data]
One
division
Two divi-
sions
FFT
MEM
FFT
Nyquist
Nyquist
MEM
ナイキスト
Running Spectrum
FFT
FFT
MEM
FFT
FFT
Nyquist
Nyquist
Nyquist
MEM
Nyquist