MR8740、MR8741_user_manual_eng_20191016H.pdf - 第235页
9.5 Numerical Calculation Type and Description 223 Chapter 9 Numerical Calculat ion Functions 8 9 9.5 Numerical Calculation T ype and Description Numerical Calculation Type Description A verage Obtains the a verage value…
9.4 Saving Numerical Calculation Results
222
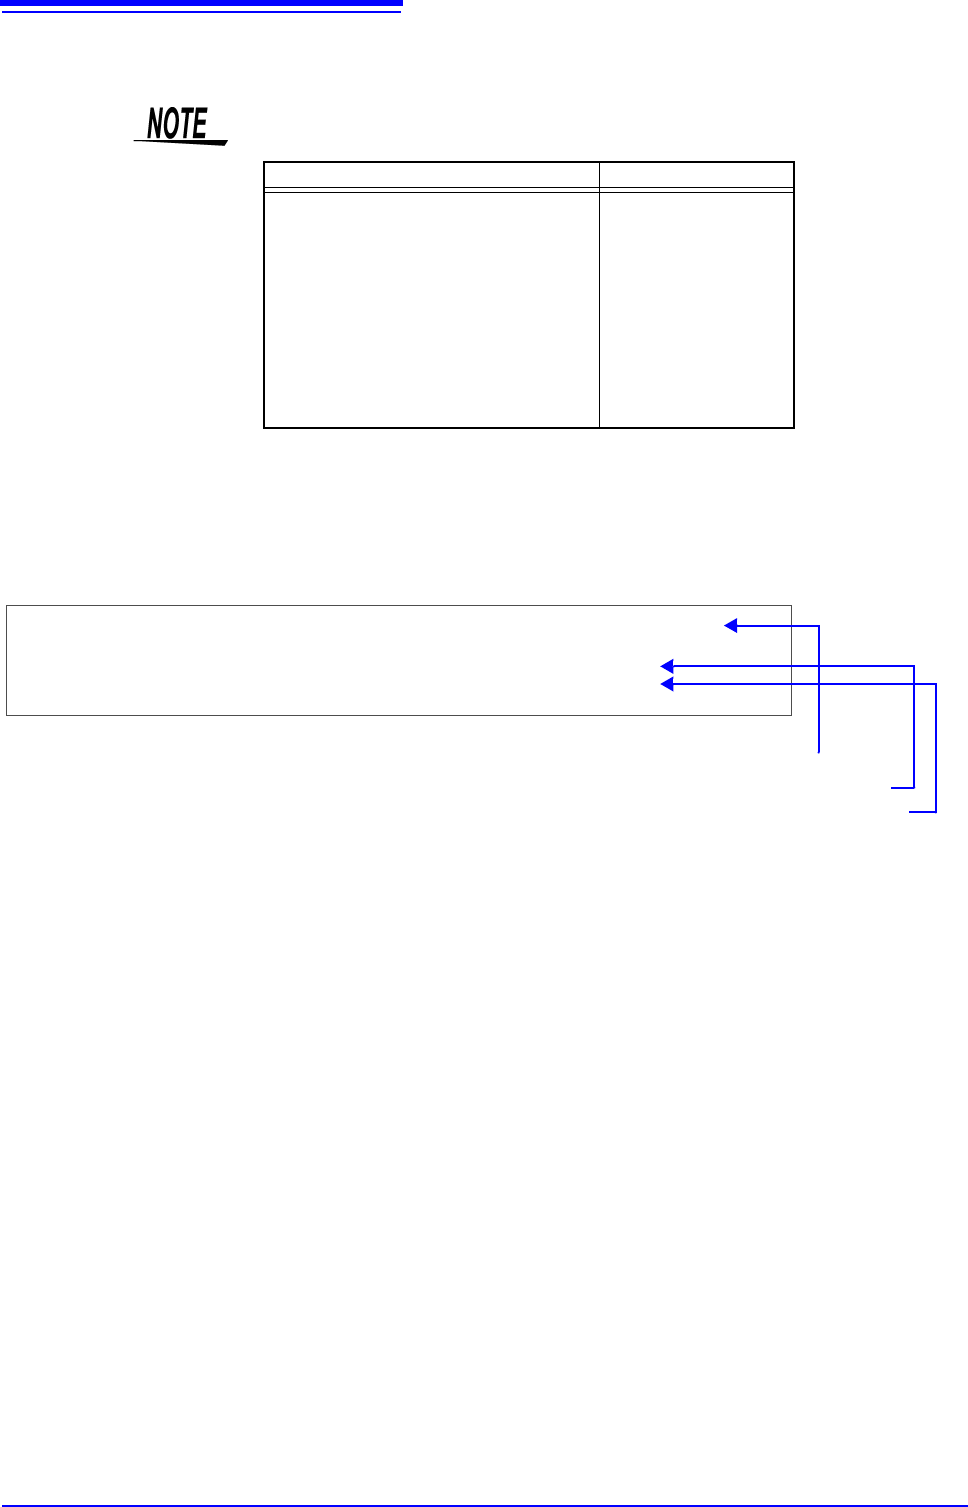
Example for saving numerical calculation results ___________________
If you save numerical calculation results, characters or display items used on the
instrument are converted as shown below.
Characters used on the instrument Saved characters
2
^2
3
^3
~u
~o
e~e
°~c
±~+
(display only)
uE
°C (
display only)
C
"Trig Time" ,"No1 Maximum Ch1" ,"No2 Minimum Ch1" ,"No3 Maximum Ch2" ,"No4 Minimum Ch2"
"","V","V","V","V"
"08-04-11 17:40:33.351","+3.00078E-05","+2.12000E-04","+2.00000E-03","+1.30000E-03"
"08-04-11 17:44:25.976","+3.06078E-05","+2.39996E-04","+2.00000E-03","+1.10000E-03"
<When calculation settings are as follows>
Calculation No. 1: Maximum value of analog channel 1
Calculation No. 2: Maximum value of analog channel 1
Calculation No. 3: Maximum value of analog channel 2
Calculation No. 4: Maximum value of analog channel 2
Line 1: Calculation Settings
Line 2: Calculation Result Unit
From Line 3: Calculation Results
Recorded in the order of the calculation settings of line 1.
9.5 Numerical Calculation Type and Description
223
Chapter 9 Numerical Calculation Functions
8
9
9.5 Numerical Calculation Type and Description
Numerical Calculation
Type
Description
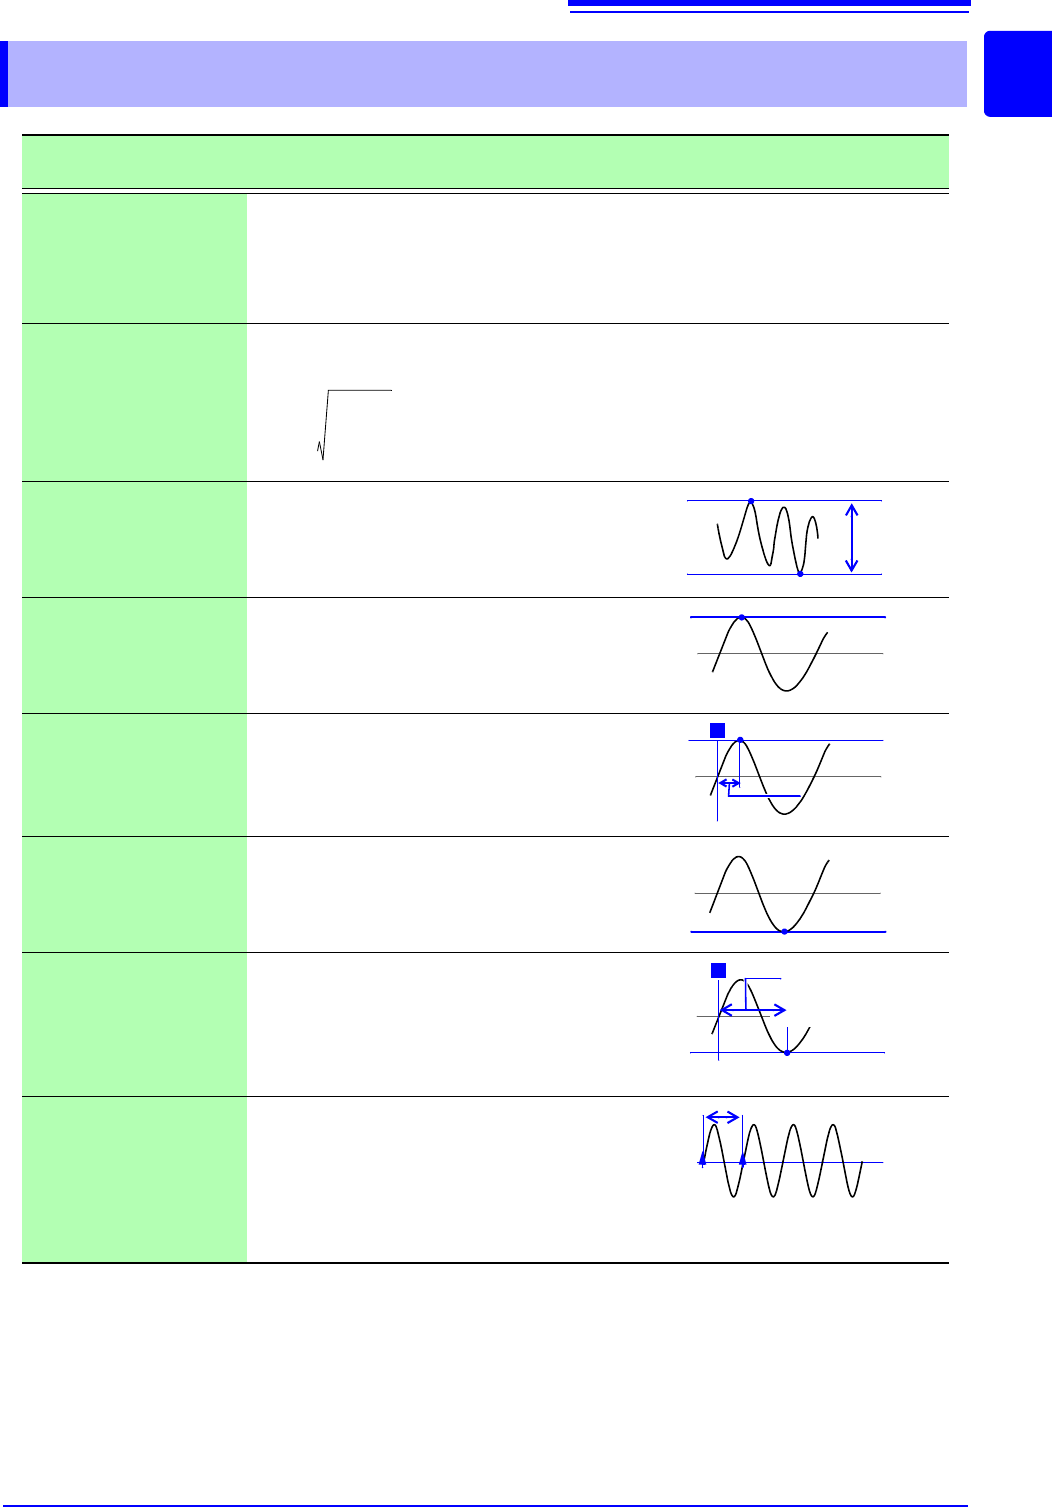
Average
Obtains the average value of waveform data.
RMS
(Root-Mean-Square)
value
(Rms)
Obtains the RMS value of waveform data. If Scaling is enabled, calculations are applied
to the waveform after scaling.
Peak-to-Peak value
(Peak-Peak)
Obtains the value of the difference (peak-to-
peak value) between maximum and mini-
mum values of waveform data.
Maximum Value
(Maximum)
Obtains the maximum value of waveform
data.
Time to Maximum
Value (Max-Time)
Obtains the time (in seconds) from the last
trigger point to the maximum value.
If the maximum value occurs in two or more
instances, the first instance is treated as the
maximum value.
Minimum Value
(Minimum)
Obtains the minimum value of waveform
data.
Time to Minimum
Value (Min-Time)
Obtains the time (s) from the trigger point to
the minimum value.
When there are two or more minimum val-
ue points, the first point of the first wave-
form for which calculation was carried out is
taken as the minimum value.
Period/Frequency
Obtains the time (in seconds) from the last
trigger point to the minimum value.
Calculates the period/frequency based on
the time difference from the point when a
specified level is crossed in the rising or
falling direction to the point when it is next
crossed.
AVE
1
n
---
di
i1=
n
=
AVE: Average value
n: Data count
di: Data on channel number i
RMS
1
n
---
di
2
i1=
n
=
RMS: RMS value
n: Data count
di: Data on channel number i
Maximum
value
Minimum
value
P-P value
Maximum
value
Maximum
value
T
Time to Maximum
Value
Minimum
value
T
Time to Minimum
Value
Minimum
value
Level
9.5 Numerical Calculation Type and Description
224
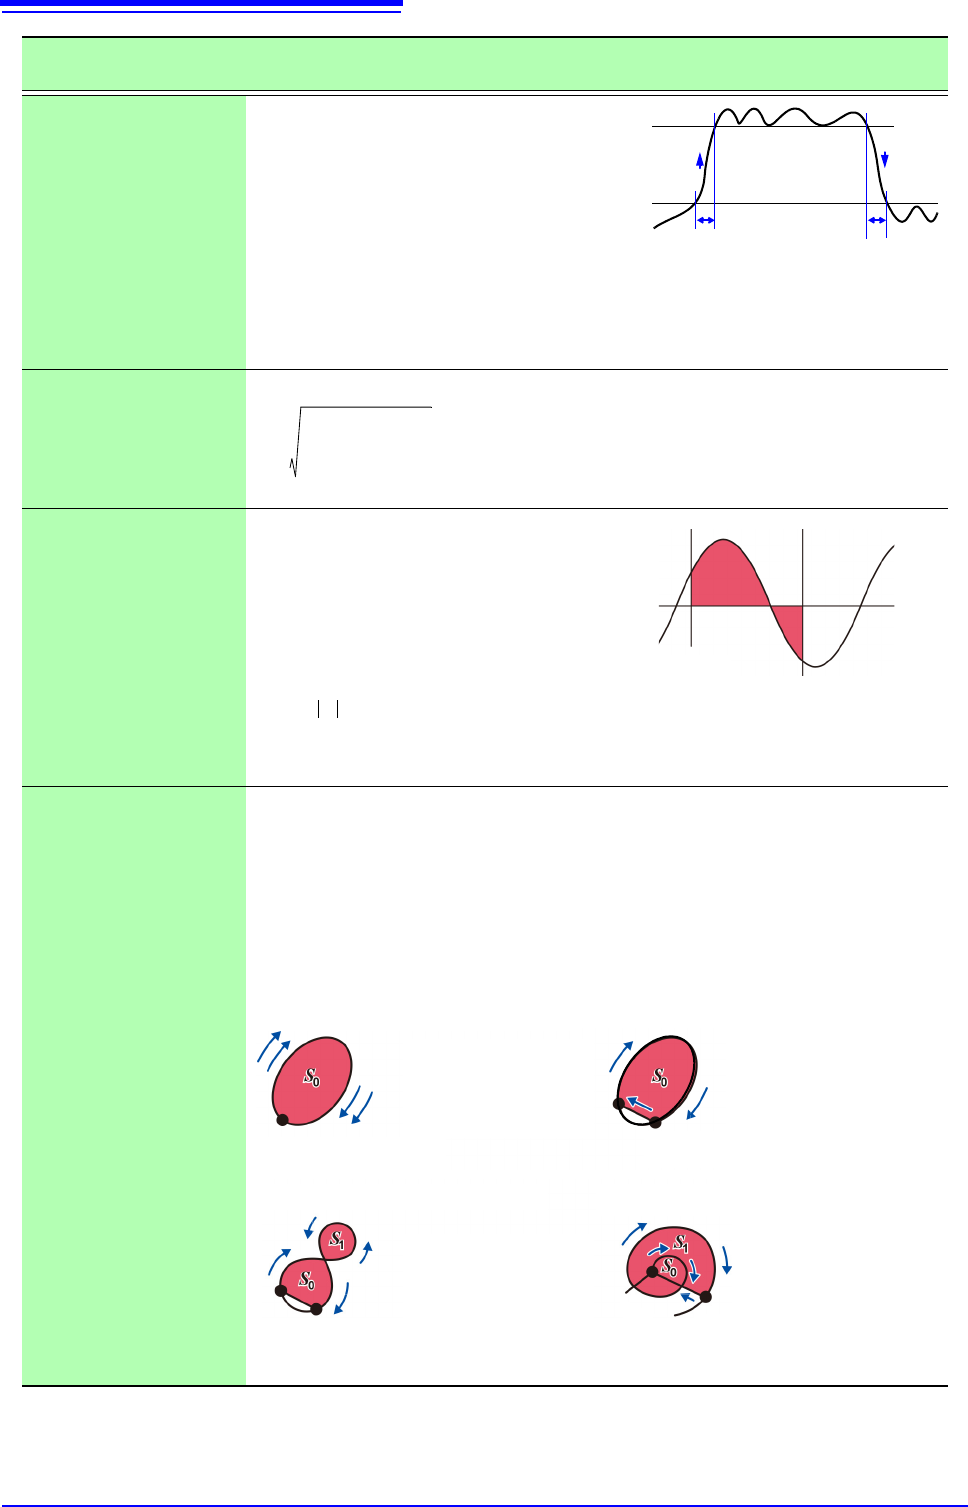
Rise Time and
Fall Time
The rise time of the acquired waveform from
A% to B% (or fall time from B% to A%) is ob-
tained by calculation using a histogram (fre-
quency distribution) of the 0 and 100%
levels of the acquired waveform.
As waveform data is acquired, the rise time
(or fall time) is obtained from the first rising
(or falling) edge.
When calculation of the range specified by
the A/B cursors is selected, the obtained
rise time (or fall time) is the first rising (or
falling) edge between the cursors.
Standard Deviation
(Std Dev)
Obtains the standard deviation of the waveform data.
Area
Obtains the area value (V•s) enclosed by
the zero position (point of zero potential)
and the signal waveform.
When calculation of the range specified by
the A/B cursors is selected, the calculated
area is constrained to the waveform be-
tween the cursors.
X-Y Area
Obtains the area (V
2
) of an X-Y composite waveform. In the following figures, the areas
within the lines are calculated. The calculation is available even if the X-Y composite
waveform is not intended for display.
To enable area calculation, specify the calculation range using the A/B cursors (Voltage
axis or Trace) on the waveform of each channel for X-Y composition. (The area cannot
be specified directly by A/B cursors on the X-Y waveform.)
See: About A/B Cursor:"6.1 Reading Measurement Values (Using the A/B Cursors)" (
p.120)
Setting Choices: Set the X- and Y-axis channels.
Numerical Calculation
Type
Description
Fall Time
Rise Time
B%
A%
A: 5 to 30%
B: 95 to 70%
1
n
---
di AVE–
2
i1=
n
=
: Standard Deviation
AVE: Average
n: Data count
di: Data on channel number i
A cursor
B cursor
Sdi
i1=
n
=h
S:Area
n: Data count
di: Data on channel number i
h=
t: Sampling rate
Start/end point
S = n × S
0
S:Area
n: Number of loops
When the trace consists of multiple
loops
When the trace is an open curve
End point
S = S
0
S:Area
(Area enclosed by the curve
and line connecting start
and end points)
Start
point
S = | S
0
- S
1
|
S:Area
When the trace is a figure-8 When the trace is an open curve
End
point
S = S
0
× 2 + S
1
S:Area
(The number of overlapping
regions increases with the
number of loops)
Start
point
End point
Start
point