MR8740、MR8741_user_manual_eng_20191016H.pdf - 第417页
Appendix 4 FFT Definitions A 21 Appendix Window Function ____________ __________________ ________________ The Fourier transform of a co ntinuous syst em is defined by th e integral Calculus in expressio n (15) for the ti…

Appendix 4 FFT Definitions
A20
Total harmonic distortion (THD) __________________________________
Total harmonic distortion (THD) indicates the proportion of the higher harmonics
to the fundamental harmonic
This means that the larger the value, the more distorted the waveform.
THD
f
n
2
f
0
2
---------------
100=
f
0
= fundamental wave
f
n
= n next higher harmonic
[%]
(14)
Appendix 4 FFT Definitions
A21
Appendix
Window Function ______________________________________________
The Fourier transform of a continuous system is defined by the integral Calculus
in expression (15) for the time range from minus infinity to plus infinity.
However, because expression (15) cannot be calculated with actual measure-
ments, the Analysis is performed on a segment between finite limits. Processing
the waveform segment within these limits is called window processing. For FFT
analysis, the waveform segment within these limits is assumed to repeat period-
ically (as shown below).
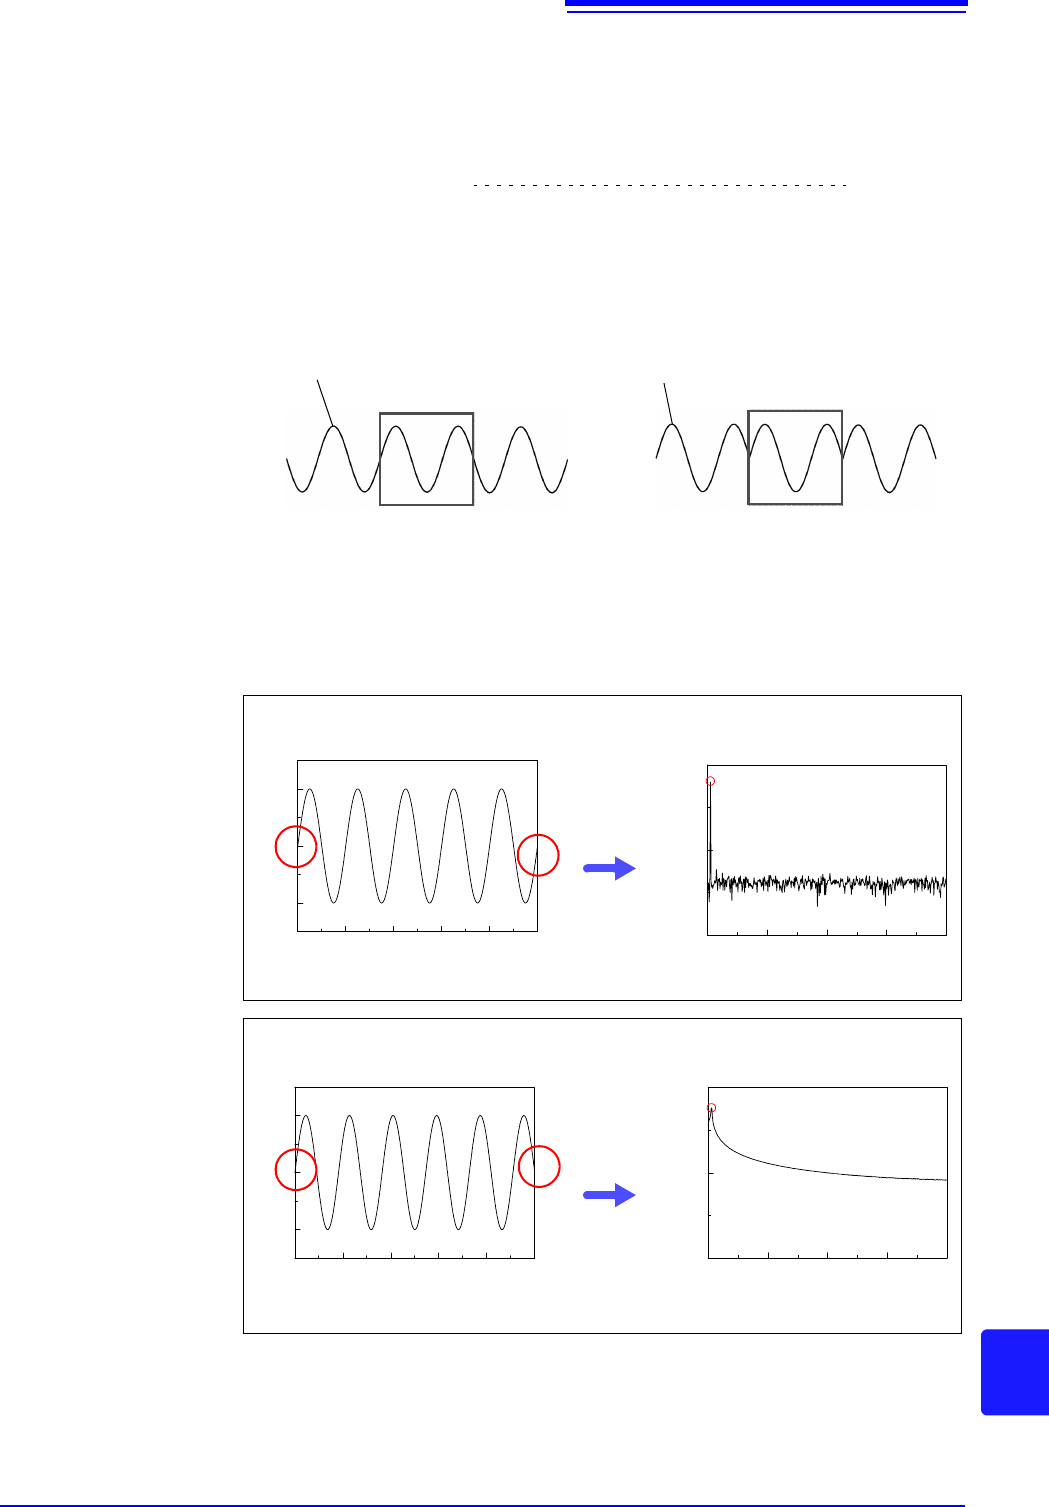
When the number of points for FFT analysis is an integer multiple of the input
signal frequency, a single-line spectrum is obtained. However, if it is not an inte-
ger multiple of the frequency (when the waveform assumed with FFT includes
discontinuous points), the spectrum is scattered, and a line spectrum cannot be
obtained. This phenomena is called leakage error (as shown below).
The window function was created to suppress such leakage errors. The window
function smoothly connects each end of the time-domain waveform where it is
cut off.
(15)
dttxfX
ft
2
)()(
Original Time-Domain Waveform
Waveform to be assumed with FFT
Time-Domain Waveform
Number of Points setting
Time-Domain Waveform
Number of Points setting
Time-domain waveform when the number of analysis points is an integer
multiple of the input frequency
Spectrum
0 0.002 0.004 0.006 0.008 0.01
-0.1
0
0.1
Time [sec]
Amplitude [V]
0 10 20 30 40
-200
-100
0
Frequency [kHz]
Magnitude [dB]
Time-Domain Waveform
Time-domain waveform when the number of analysis points is not an
integer multiple of the input frequency
Spectrum
0 0.002 0.004 0.006 0.008 0.01
-0.1
0
0.1
Time [sec]
Amplitude [V]
0 10 20 30 40
-200
-100
0
Frequency [kHz]
Magnitude [dB]
Time-Domain Waveform
Appendix 4 FFT Definitions
A22
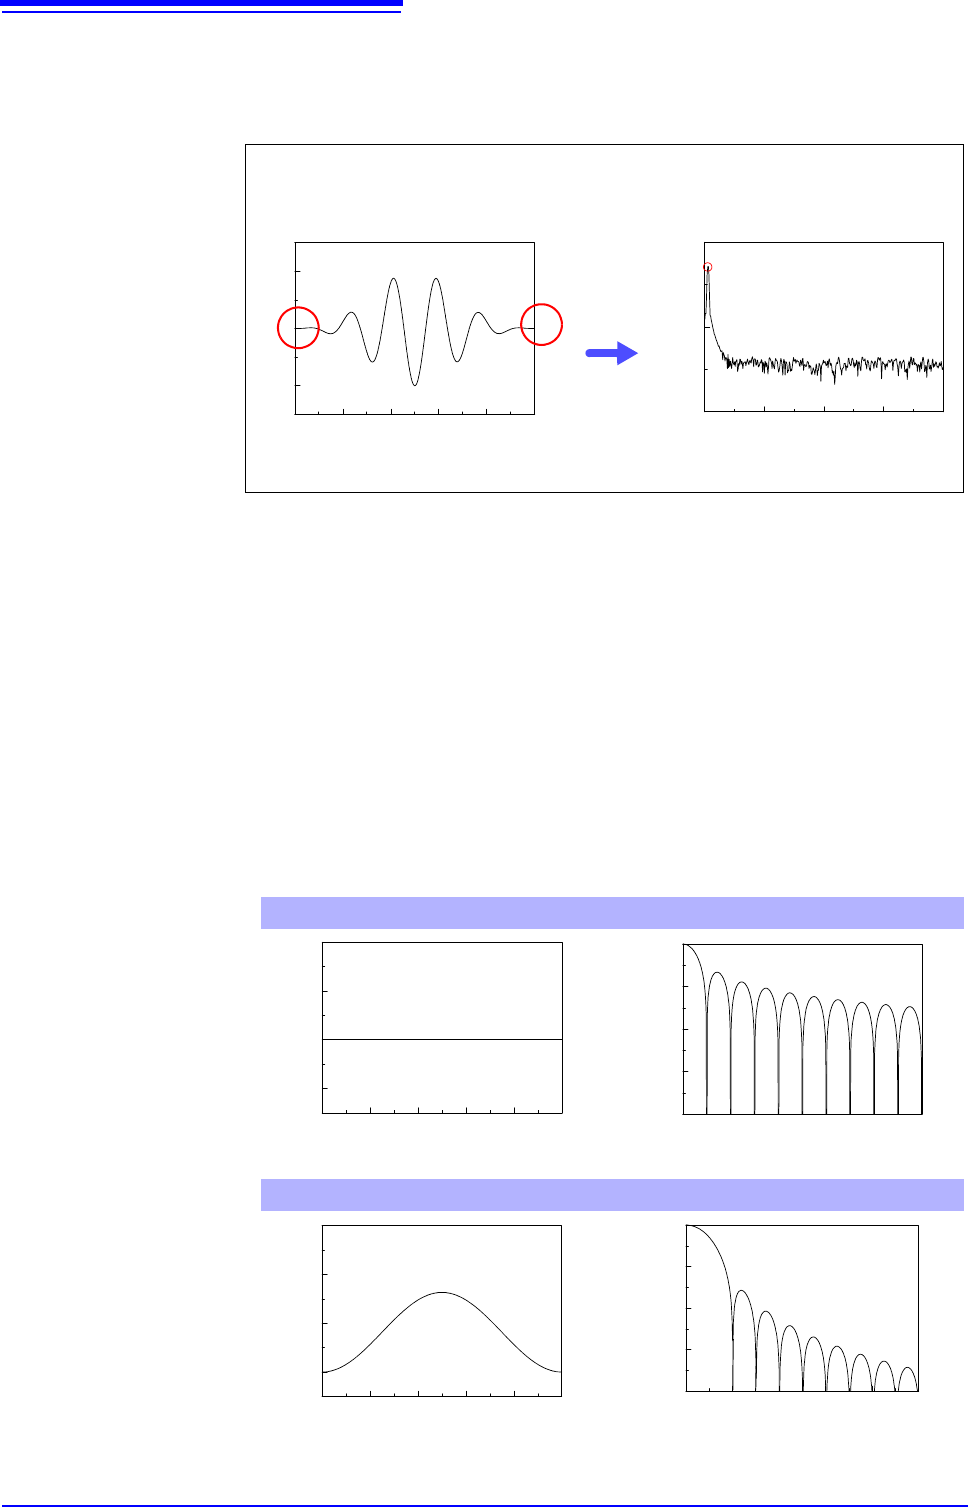
The following figure presents an example of spectral analysis by applying a win-
dow function to a time-domain waveform.
Using the window function, discontinuous points on the time-domain waveform
are eliminated, so the wave shape approaches a line spectrum.
The following figure shows the time-domain waveform of the window function
and its spectrum.
Each spectrum shows a large peak at a low frequency, and many smaller peaks
at higher frequencies. The largest peak is called the main lobe, and the smaller
peaks are the side lobes.
The most accurate results of the FFT function are obtained when the width of the
main lobe and the amplitude of the side lobes are minimized, although both con-
ditions cannot be satisfied at the same time.
Therefore, a window function having a wide main lobe is used when amplitude
values are important, while a window function having a small main lobe is used
to observe fine spectral details, and a window function having small side lobe
amplitudes is used to exclude the effects of the surrounding spectrum.
However, because the main lobe width is proportional to the width (1/W) of the
window, increasing the number of analysis points increases the frequency reso-
lution.
0 0.002 0.004 0.006 0.008 0.01
-0.1
0
0.1
Time [sec]
Amplitude [V]
When a Blackman-Harris window function is applied to a time-domain
waveform ( p.21) in which the number of analysis points is not an inte-
ger multiple of the input frequency
Spectrum
0 10 20 30 40
-200
-100
0
Frequency [kHz]
Magnitude [dB]
Time-Domain Waveform
Rectangular window
Time-Domain Waveform Spectrum
Hann window
Time-Domain Waveform Spectrum
N-10
Amplitude
0
0 2 4 6 8 10
-80
-60
-40
-20
0
Frequency (1/W)
Gain [dB]
N-10
Amplitude
0
0 2 4 6 8 10
-80
-60
-40
-20
0
Frequency ( 1/W)
Gain [dB]