MR8740、MR8741_user_manual_eng_20191016H.pdf - 第419页
Appendix 4 FFT Definitions A 23 Appendix Exponential window Time-Domain Waveform Spectrum Hamming window Time-Domain Waveform Spectrum Blackman win dow Time-Domain Waveform Spectrum Blackman-H arris window Time-Domain Wa…
Appendix 4 FFT Definitions
A22
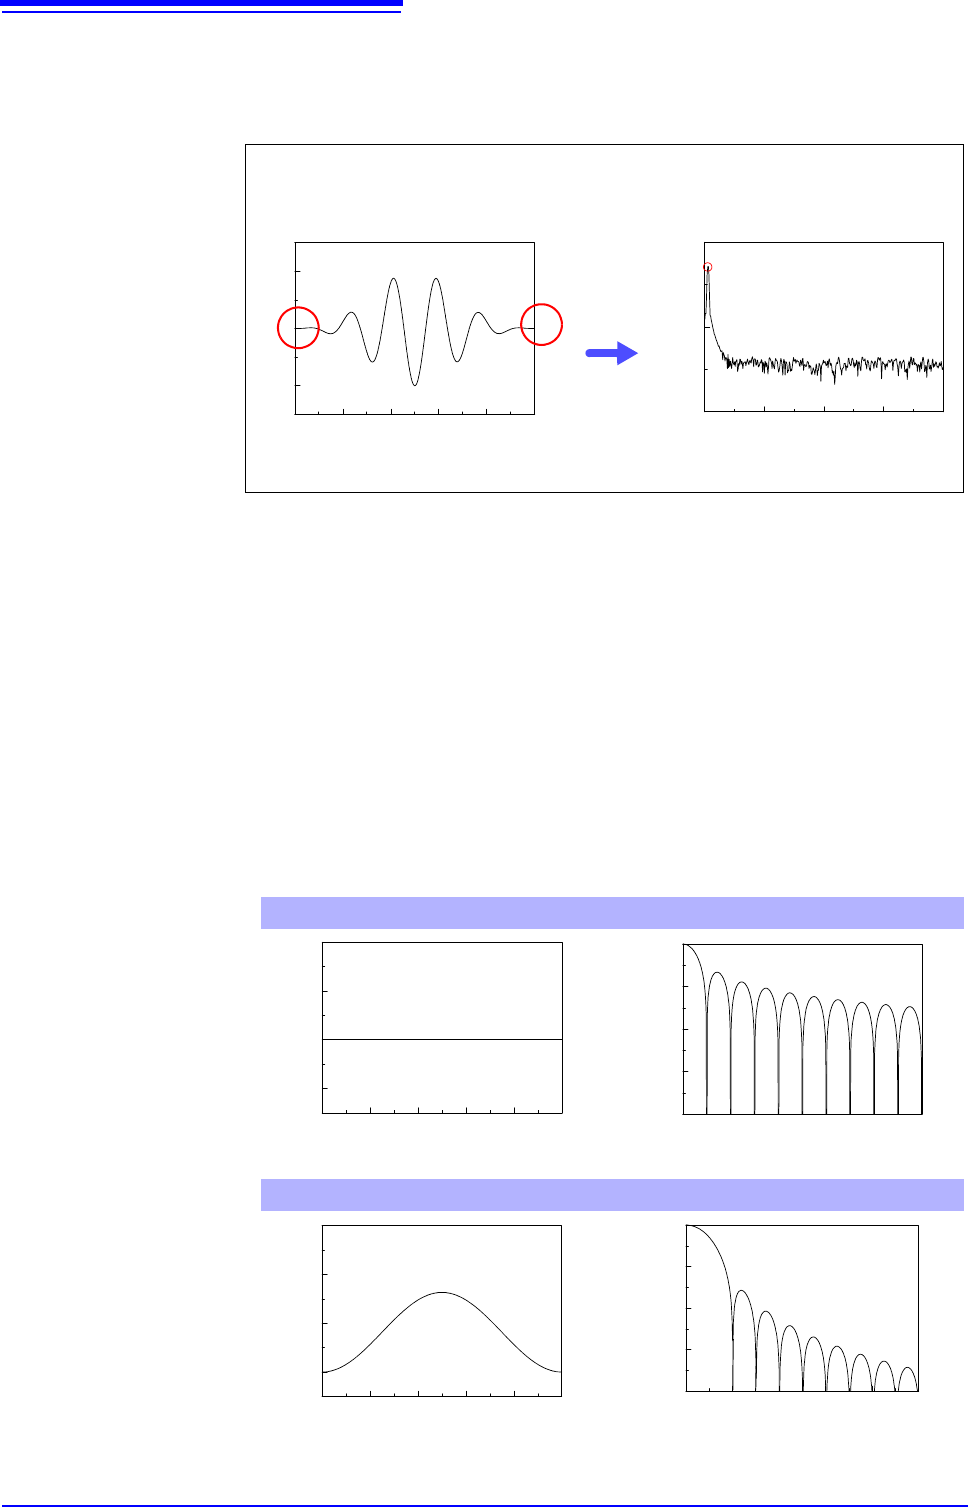
The following figure presents an example of spectral analysis by applying a win-
dow function to a time-domain waveform.
Using the window function, discontinuous points on the time-domain waveform
are eliminated, so the wave shape approaches a line spectrum.
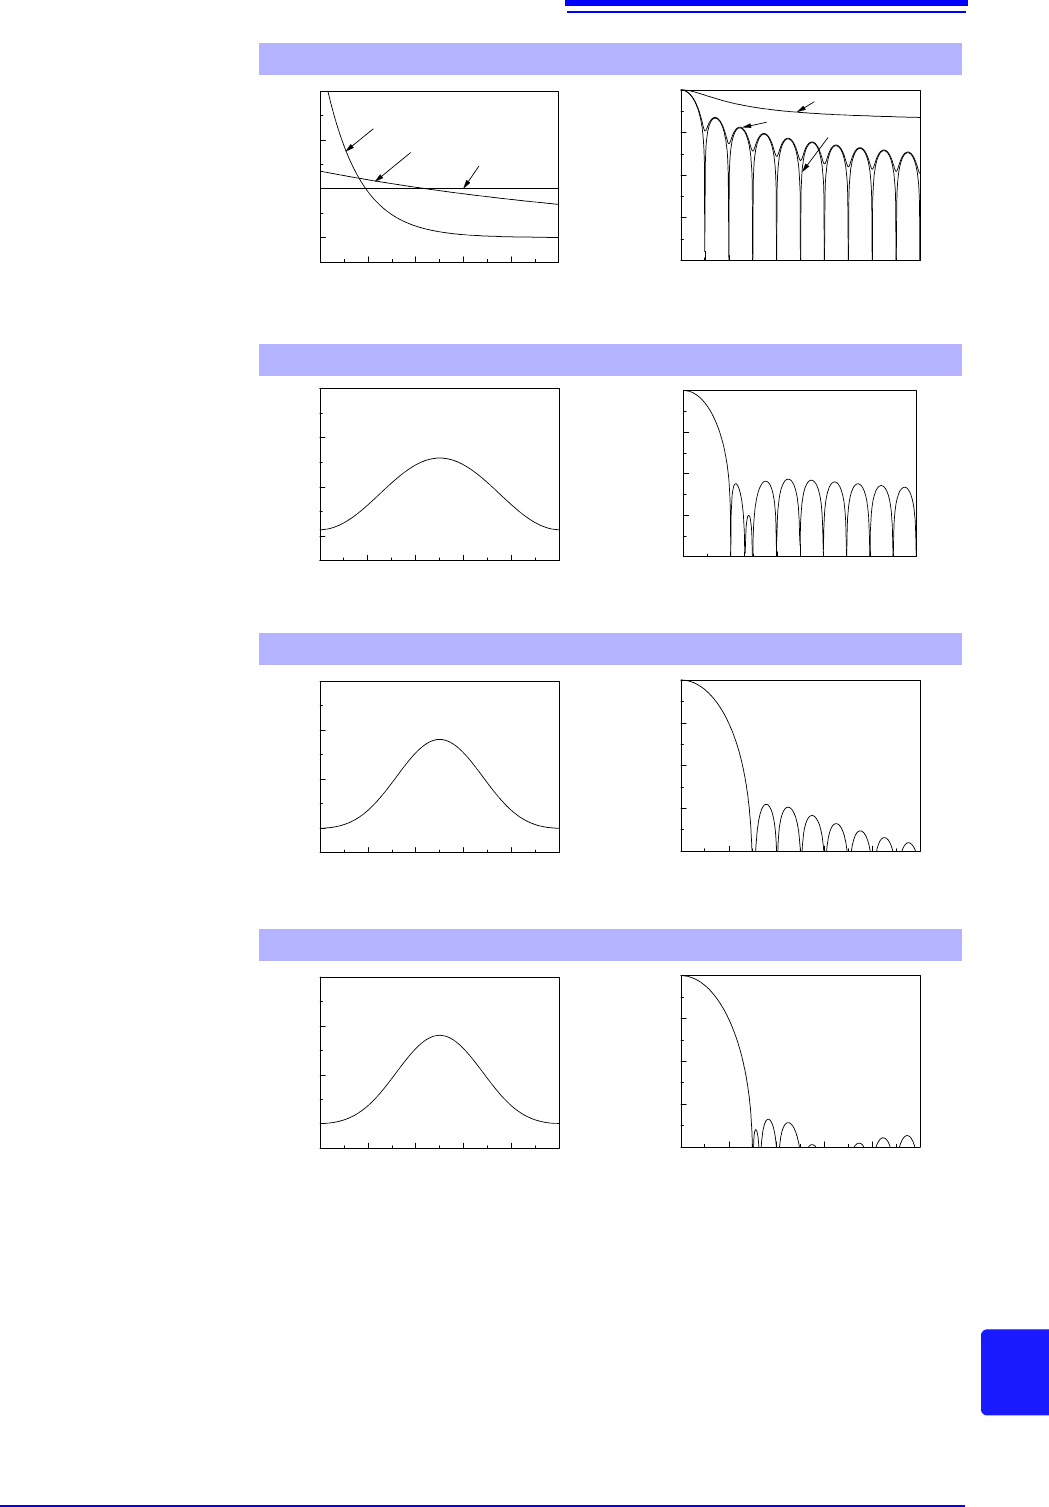
The following figure shows the time-domain waveform of the window function
and its spectrum.
Each spectrum shows a large peak at a low frequency, and many smaller peaks
at higher frequencies. The largest peak is called the main lobe, and the smaller
peaks are the side lobes.
The most accurate results of the FFT function are obtained when the width of the
main lobe and the amplitude of the side lobes are minimized, although both con-
ditions cannot be satisfied at the same time.
Therefore, a window function having a wide main lobe is used when amplitude
values are important, while a window function having a small main lobe is used
to observe fine spectral details, and a window function having small side lobe
amplitudes is used to exclude the effects of the surrounding spectrum.
However, because the main lobe width is proportional to the width (1/W) of the
window, increasing the number of analysis points increases the frequency reso-
lution.
0 0.002 0.004 0.006 0.008 0.01
-0.1
0
0.1
Time [sec]
Amplitude [V]
When a Blackman-Harris window function is applied to a time-domain
waveform ( p.21) in which the number of analysis points is not an inte-
ger multiple of the input frequency
Spectrum
0 10 20 30 40
-200
-100
0
Frequency [kHz]
Magnitude [dB]
Time-Domain Waveform
Rectangular window
Time-Domain Waveform Spectrum
Hann window
Time-Domain Waveform Spectrum
N-10
Amplitude
0
0 2 4 6 8 10
-80
-60
-40
-20
0
Frequency (1/W)
Gain [dB]
N-10
Amplitude
0
0 2 4 6 8 10
-80
-60
-40
-20
0
Frequency ( 1/W)
Gain [dB]
Appendix 4 FFT Definitions
A23
Appendix
Exponential window
Time-Domain Waveform Spectrum
Hamming window
Time-Domain Waveform Spectrum
Blackman window
Time-Domain Waveform Spectrum
Blackman-Harris window
Time-Domain Waveform Spectrum
N-10
Amplitude
0
0.1%
50%
99.9%
Gain [dB]
0 2 4 6 8 10
-80
-60
-40
-20
0
Frequency (1/W)
0.1%
50%
99.9%
N-10
Amplitude
0
0 2 4 6 8 10
-80
-60
-40
-20
0
Frequency (1/W)
Gain [dB]
N-10
Amplitude
0
0 2 4 6 8 10
-80
-60
-40
-20
0
Frequency (1/W)
Gain [dB]
N-10
Amplitude
0
0 2 4 6 8 10
-80
-60
-40
-20
0
Frequency (1/W)
Gain [dB]
Appendix 4 FFT Definitions
A24
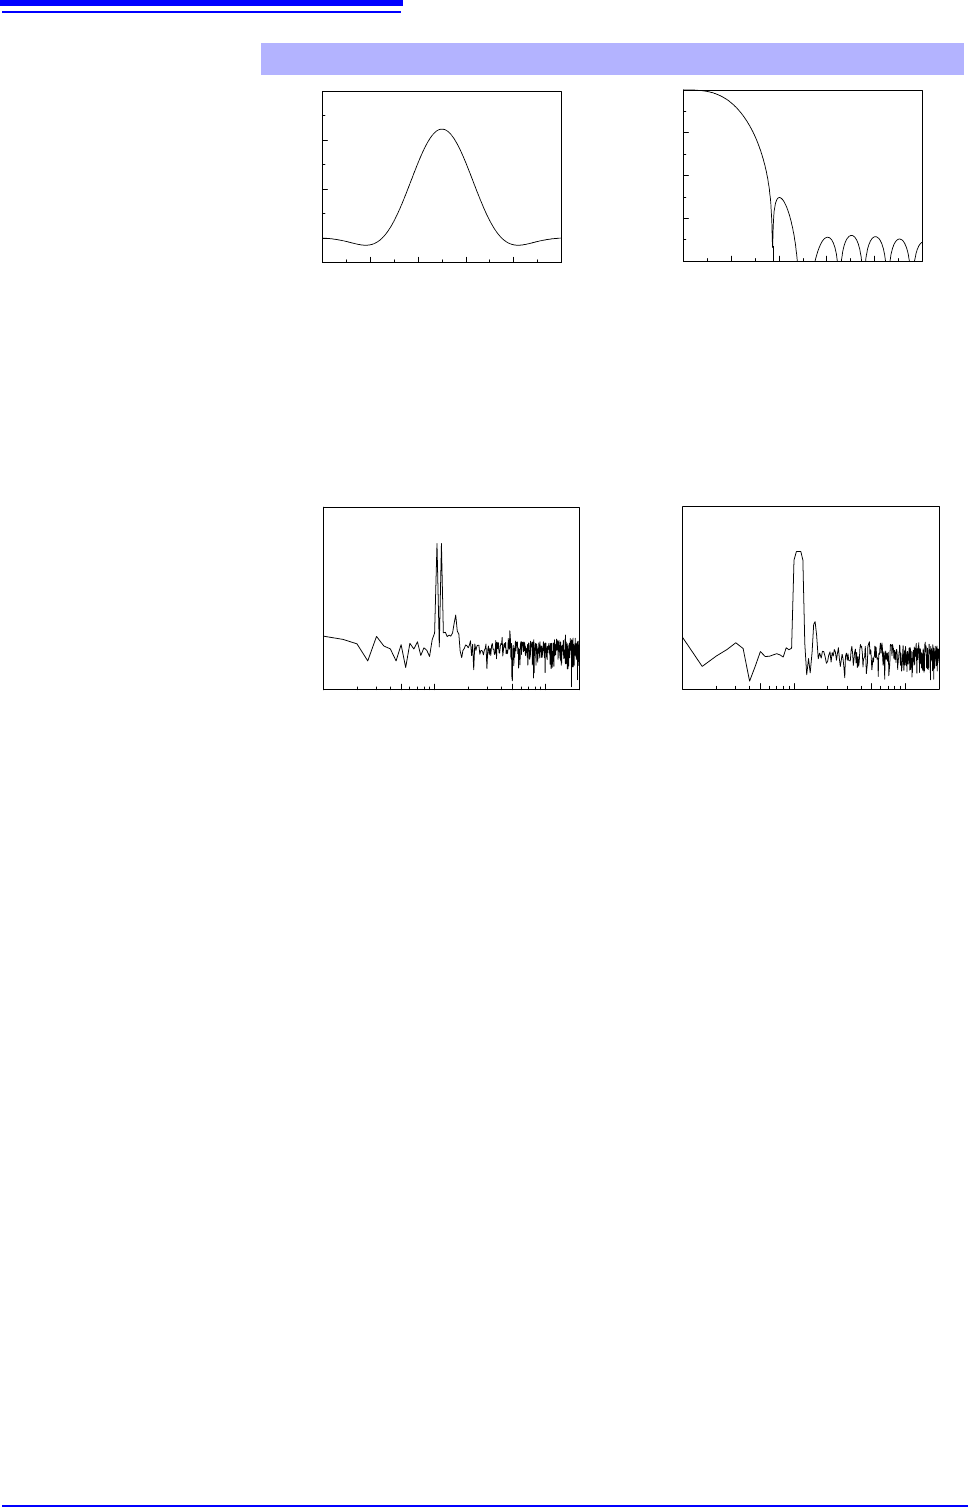
The following example shows input sine waves of 1050 and 1150 Hz analyzed
with different window functions. Because the frequencies in this example are
close to one another, a rectangular window with a narrow main lobe is able to
separate and display both frequencies, but a Hann window with a wide main lobe
displays the two as a single spectral component.
Flat top window
Time-Domain Waveform Spectrum
Analysis Using a Rectangular Window Analysis Using a Hann Window
N-10
Amplitude
0
0 2 4 6 8 10
-80
-60
-40
-20
0
Frequency (1/W)
Gain [dB]
100 500 1000 5000 10000
-100
-50
0
Frequency [Hz]
Amplitude [dB]
100 500 1000 5000 10000
-100
-50
0
Frequency [Hz]
Amplitude [dB]