MR8740、MR8741_user_manual_eng_20191016H.pdf - 第269页
12.3 Setting FFT Analysis Conditio ns 257 11 Chapter 12 FFT Function 12 FFT Analy sis Modes and A veraging When averaging time-domain wa veform values: Waveforms are acquired and averaged within th e time domain. After…
12.3 Setting FFT Analysis Conditions
256
The averaging function calculates the average of the values obtained from multiple measurements of a peri-
odic waveform. This can reduce noise and other non-periodic signal components. Averaging can be applied
to a time-domain waveform or to a spectrum.
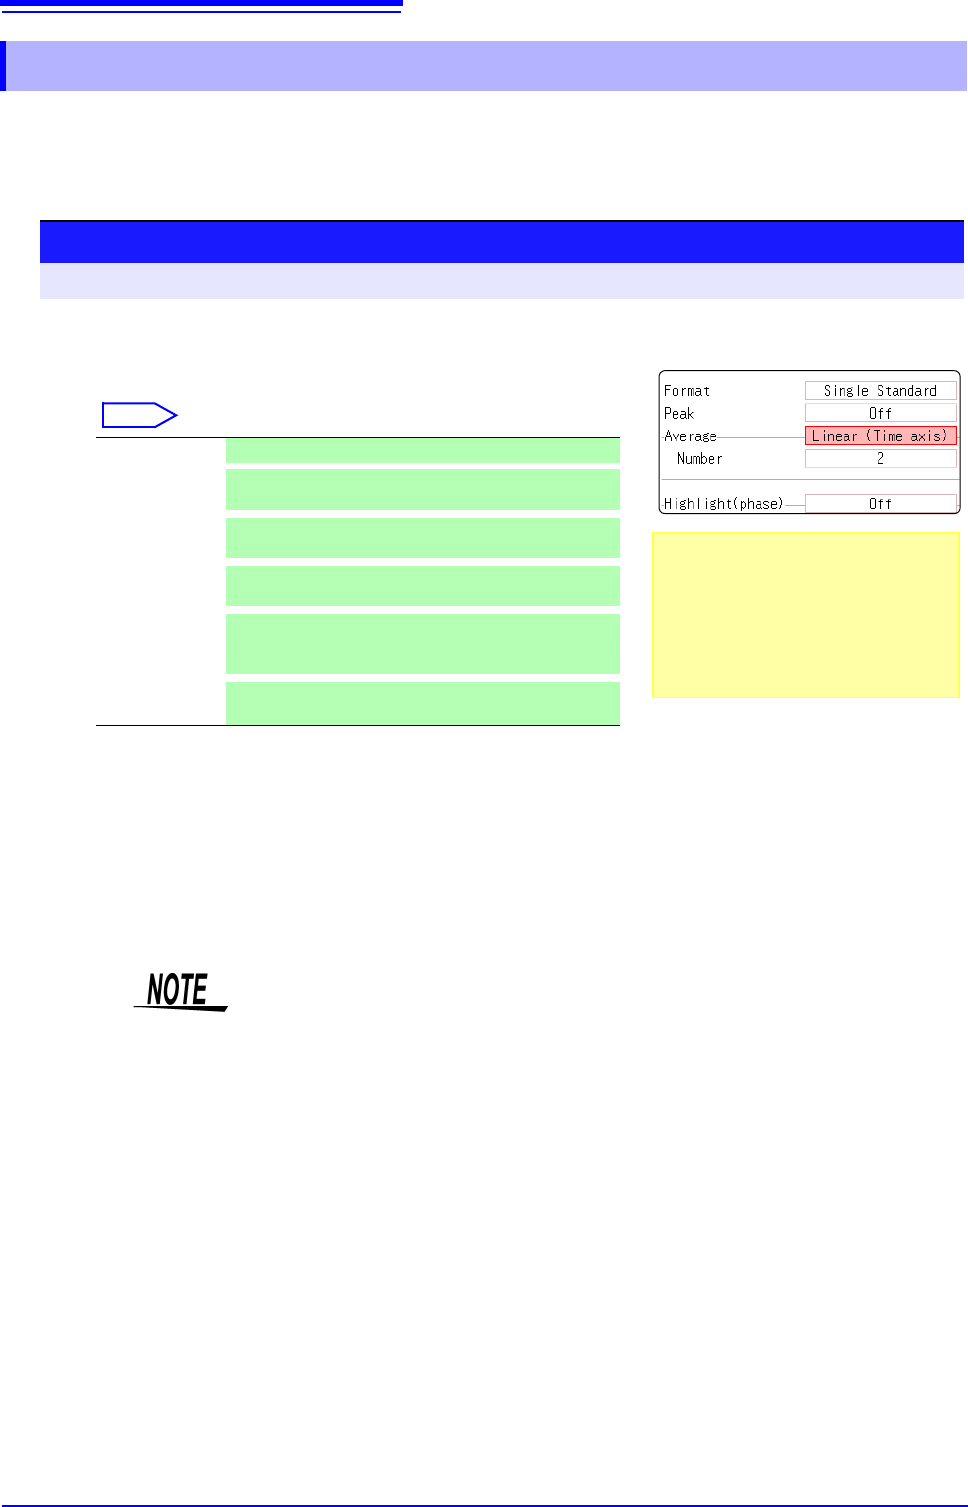
12.3.7 Averaging Waveforms
1
Enable averaging.
Move the flashing cursor to the [Average] item.
Select
2
Select the count for averaging.
Move the flashing cursor to the [Number] item.
Select the number of measurements to be averaged.
Setting range: 2 to 10,000
Off Averaging is disabled. (default setting)
Linear
(Time axis)
Time-domain waveforms are summed and averaged
and then calculation is performed.
Expo.
(Time axis)
The exponential mean of time-domain waveforms is
determined and then calculation is performed.
Linear
(Frequency)
Frequency-domain waveforms are summed and aver-
aged and then the calculation result is output.
Expo.
(Frequency)
The exponential mean of frequency-domain wave-
forms is determined and then the calculation result is
output.
Peak
(Frequency)
The maximum value of frequency-domain waveforms
is retained.
Procedure
To open the screen: Right-click and select [STATUS] [Status] sheet
About averaging calculation formulas
See: "Averaging" (p.A19)
When averaging and auto saving are
enabled at the same time
Data is saved after the specified count of
values have been averaged.
See: "Trigger Modes and Averaging"
(p.258)
1
2
• After measuring with averaging enabled, display is not available when the
channel is changed. Also, when the analysis mode is changed, the analysis
modes that can be displayed are limited.
• When averaging is performed with the analysis mode disabled (Off), no trace
is displayed when the analysis mode is changed after measurement.
• When [Format] is set to [Running spectrum], [Average] cannot be set.
12.3 Setting FFT Analysis Conditions
257
11
Chapter 12 FFT Function
12
FFT Analysis Modes and Averaging
When averaging time-domain waveform values:
Waveforms are acquired and averaged within the time domain. After averaging, FFT
calculation is performed.
When the trigger mode is [Auto]: Data is acquired when measurement is started, even
if trigger criteria are not met after a certain interval. So if averaging is applied to an asyn-
chronous signal, the resulting data is meaningless.
Synchronous signals have better SNR (signal-to-noise ratio) and are more suitable for
analysis.
When averaging spectrum values:
Acquired data is first subject to FFT analysis. After analysis, averaging is performed
within the frequency range, and the result is displayed. This differs from time-domain av-
eraging in that averaging can be performed without trigger synchronization. However, if
the characteristics of the input waveform allow triggering, using the trigger for synchro-
nization is recommended.
Spectrum peak hold:
After performing FFT calculations on the acquired waveform, peak values are retained
(held) and displayed within the frequency range.
: Settable, ×: Cannot be set,
O
: Partially settable
Analysis Mode
Averaging
Waveform Averaging Spectrum Averaging
Simple
Exponen-
tial
Simple Exponential
Peak
Hold
OFF
×××××
Storage Waveform
×××
Histogram
×××
Linear Spectrum
O
*2
O
*2
O
*2
RMS Spectrum
O
*2
O
*2
O
*2
Power Spectrum
Power Spectrum Density *1
LPC analysis(Power Spectrum Density) *1
×××
Transfer Function
O
*2
O
*2
O
*2
Cross Power Spectrum
O
*2
O
*2
O
*2
Impulse Response
Coherence Function
×××
Phase Spectrum
×××
Auto-correlation Function
Cross-correlation Function
1/1 Octave Analysis *1
1/3 Octave Analysis *1
*1. Not available for external sampling
*2. Not available when the y axis is real (linear) or imaginary (linear), or for Nyquist plots
12.3 Setting FFT Analysis Conditions
258
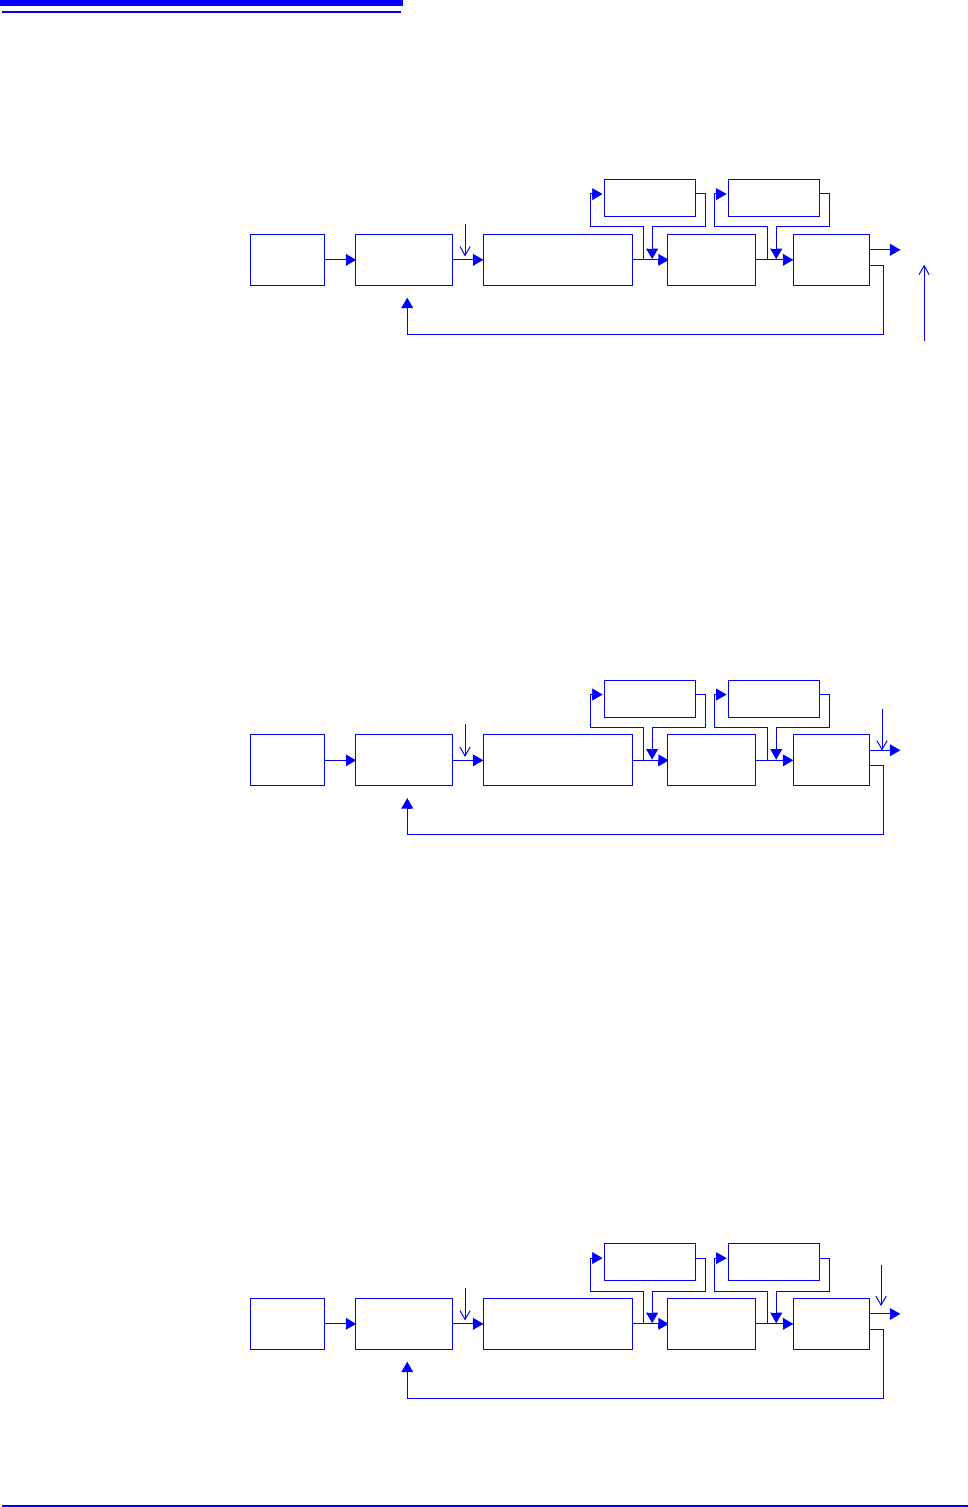
Trigger Modes and Averaging
If the trigger mode is [Single] or the calculation setting is [Once]
Measurements continue until the specified number of averaging points is acquired.
If the trigger mode is [Continue] or the calculation setting is [Repeat]
Measurement continues after the specified averaging count has been acquired.
When the specified averaging count is exceeded, averaging is repeated and measurement continues until
[STOP] is
clicked.
When the trigger mode is [Auto]
•For time-domain waveforms:
Data is acquired when [START] is clicked, even if trigger criteria are not met after a certain interval. So
if averaging is applied to an asynchronous signal, the resulting data is meaningless.
•For spectrum values:
When [START] is clicked, measurement starts. Even if the trigger criteria are not met, the specified
amount of data is acquired, and after FFT analysis, the results are averaged.
When the specified averaging count is exceeded, averaging is repeated and measurement continues
until [STOP] is clicked.
When the acquired count < the specified count *
1
When the acquired
count = the speci-
fied count
Start Measurement
[START]
End *
2
Trigger
criteria met
Input
Signal
Awaiting
Trigger
Waveform acquisi-
tion (specified no.
of points)
Averaging
Display*
3
FFT
analysis
(Spectrum averaging)
(Waveform averaging)
*1. Awaiting trigger continues until the specified count is reached.
*2. Measurement stops automatically when the specified count is
reached. If measurement was interrupted by clicking [STOP], the
averaging result up to that point is displayed.
*3 If [Reference] is [New Data] and the automatic saving setting is
ON, data is saved when the specified number of times is
reached.
FFT
analysis
Repeats until [STOP] is clicked
Start Measurement
[START]
End*
1
Trigger
criteria met
Input
Signal
Awaiting
Trigger
Waveform acquisi-
tion (specified no.
of points)
Averaging
Display*
2
FFT
analysis
(Spectrum averaging)
(Waveform averaging)
*1 When stopped before the specified count, the average up to that point is displayed.
*2 If [Reference] is
[New Data] and the automatic saving setting is On, data is saved
when the specified number of times is reached.
FFT
analysis
[STOP]
Repeats until [STOP] is clicked
Start Measurement
[START]
End*
After a certain interval,
acquisition starts even if
trigger criteria are not met
Input
Signal
Awaiting
Trigger
Waveform acquisi-
tion (specified no.
of points)
Averaging
Display
FFT
analysis
(Spectrum averaging)
(Waveform averaging)
* When stopped before the specified count, the average up to that point is clicked.
FFT
analysis
[STOP]