MR8740、MR8741_user_manual_eng_20191016H.pdf - 第413页
Appendix 4 FFT Definitions A 17 Appendix Anti-Aliasing Filters _______ _____________________ ________________ When the maximum frequency compon ent of the input signal is higher than one- half of the sampling freq uency,…
Appendix 4 FFT Definitions
A16
Aliasing ______________________________________________________
When the frequency of a signal to be measured is higher than the sampling rate,
the observed frequency is lower than that of the actual signal, with certain fre-
quency limitations. This phenomena occurs when sampling occurs at a lower fre-
quency than that defined by the Nyquist-Shannon sampling theorem, and is
called aliasing.
If the highest frequency component of the input signal is f
max
and the sampling
frequency is f
s
, the following expression must be satisfied:
Therefore, if the input includes a frequency component higher than f
s
/2, it is
observed as a lower frequency (alias) that does not really exist.
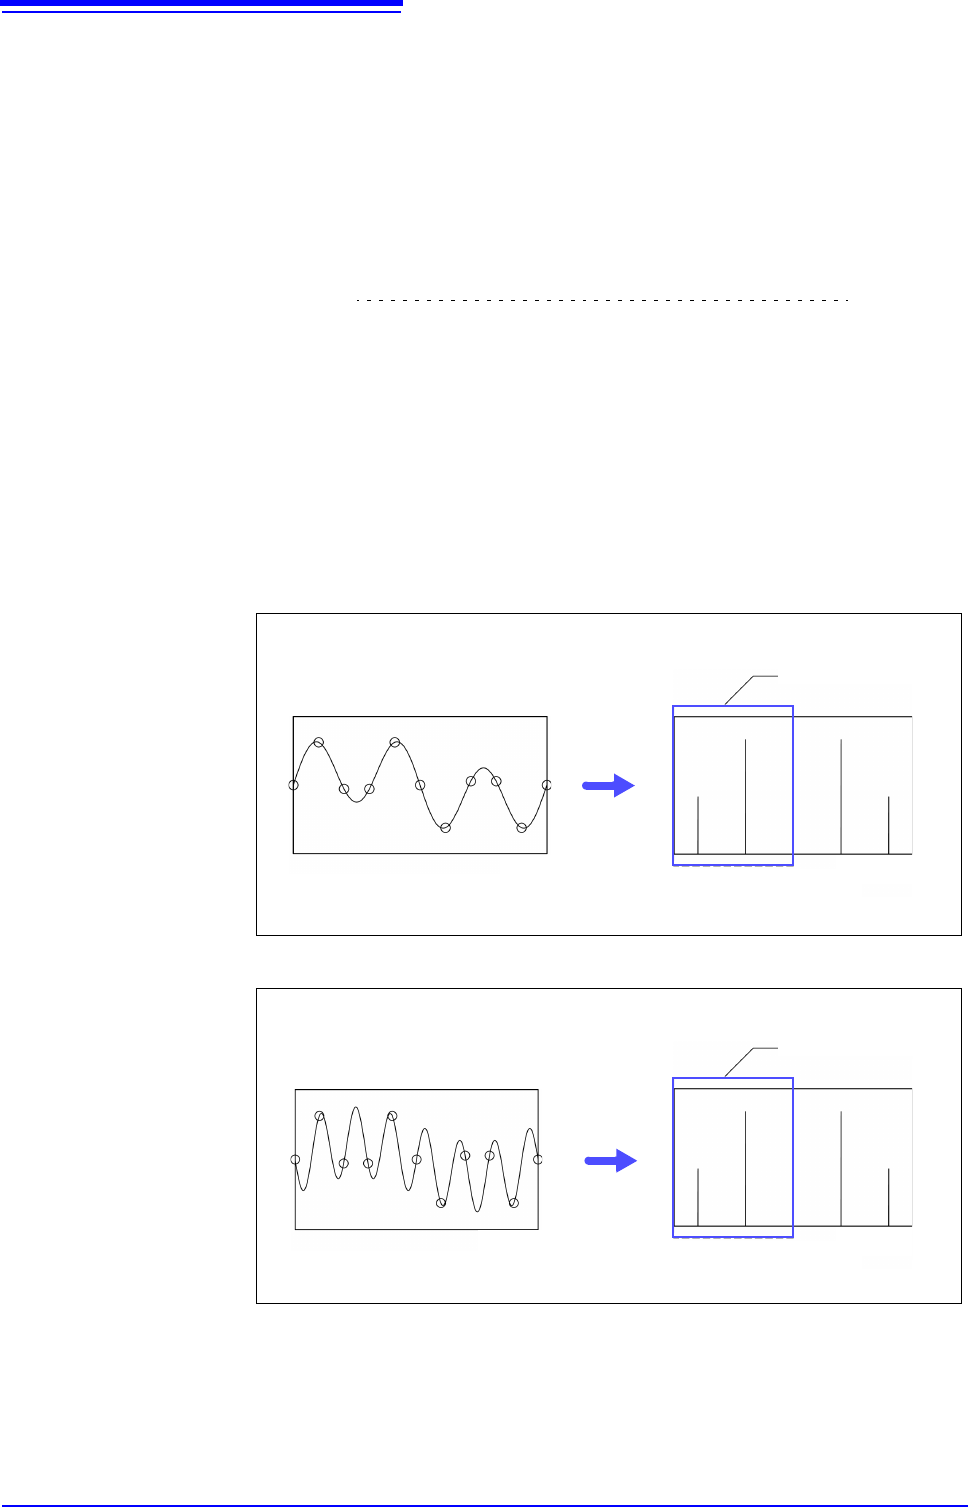
The following diagrams show the results of spectrum analysis of composite
waveforms having components of 1 kHz and 3 kHz, and of 1 kHz and 7 kHz.
If sampling frequency f
s
is 10 kHz, the spectral component of an input frequency
above 5 kHz (in this case, 7 kHz) is observed as an alias at 5 kHz or below.
In this example the difference between the 3 and 7 kHz components is indiscern-
ible.
max
2 ff
s
(10)
Composite waveform of 1 kHz and 3 kHz components sampled at 10 kHz
Time
Portion Displayed on
Screen
Spectrum
1357
Frequency
[kHz]
Composite waveform of 1 kHz and 7 kHz components sampled at 10 kHz
Time
Spectrum
Frequency
[kHz]
1357
Portion Displayed on
Screen
Appendix 4 FFT Definitions
A17
Appendix
Anti-Aliasing Filters ____________________________________________
When the maximum frequency component of the input signal is higher than one-
half of the sampling frequency, aliasing distortion occurs. To eliminate aliasing
distortion, a low-pass filter can be used that cuts frequencies higher than one-
half of the sampling frequency. Such a low-pass filter is called an anti-aliasing fil-
ter.
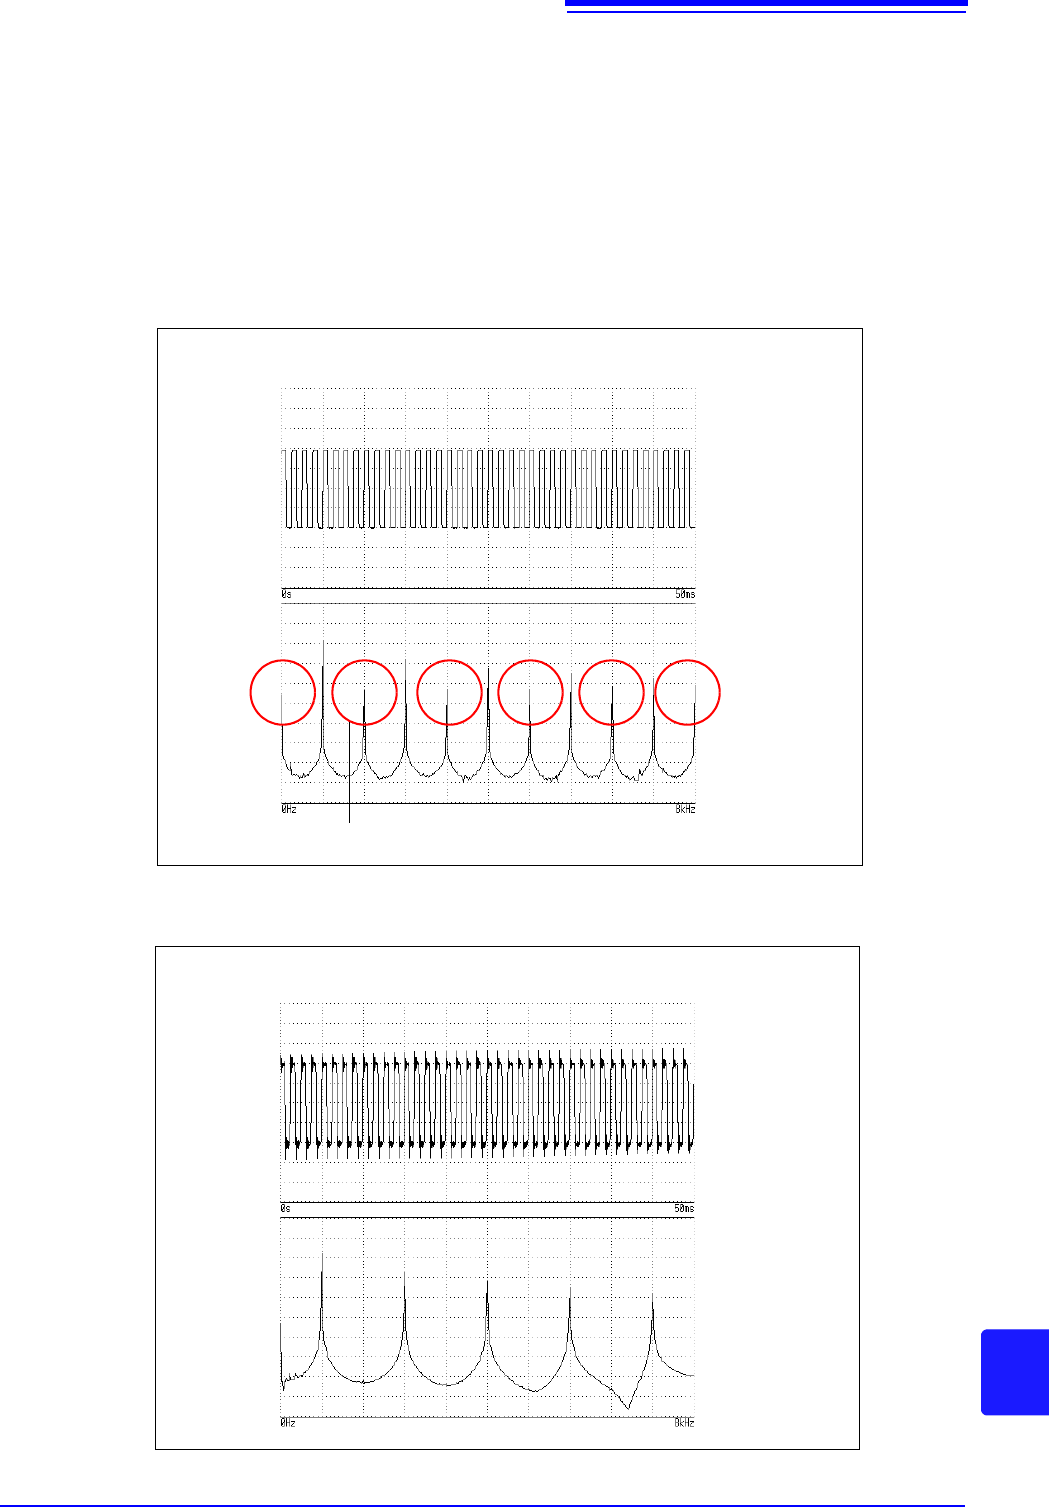
The following figures show the effect of application of an anti-aliasing filter on a
square wave input waveform.
Non-existent frequency components are observed.
Without an anti-aliasing filter
Input time
waveform
Frequency analysis
results
With an anti-aliasing filter
Input time
waveform
Frequency analysis
results
Appendix 4 FFT Definitions
A18
Imaging ______________________________________________________
When the instrument is set to a measurement frequency range that requires a
higher sampling rate than the maximum capability of the module, intermediate
data points are interpolated between successive data samples. In this case, the
time-domain waveform exhibits a stair-step shape. When FFT analysis is per-
formed in this situation, non-existent high frequency spectral components
appear. This phenomena is called zero-order hold characteristic imaging.
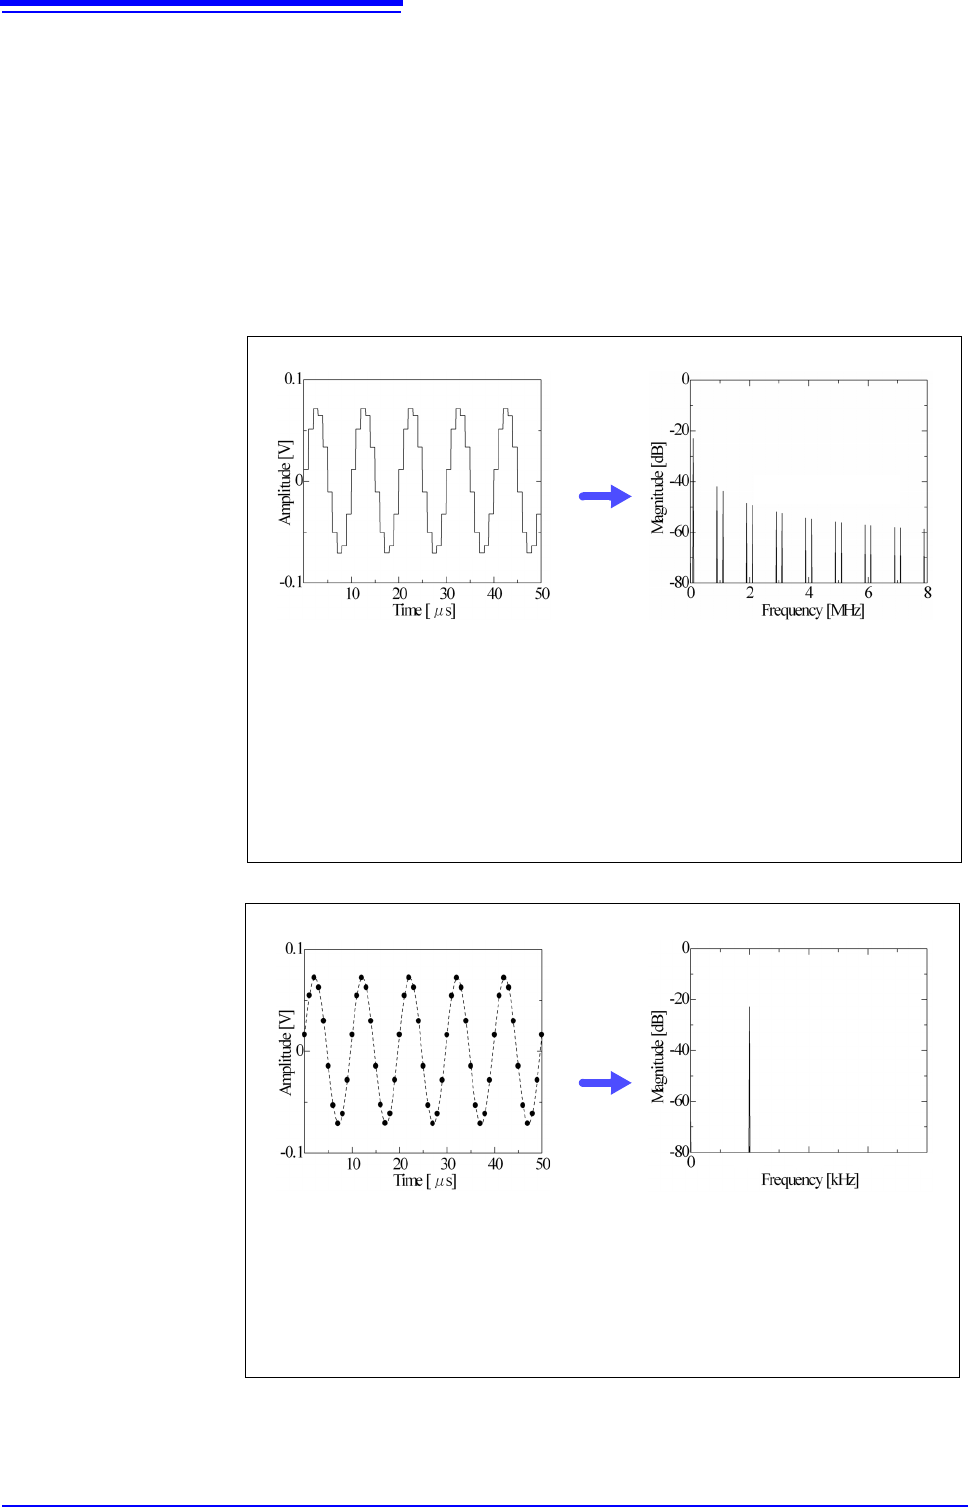
The following figures show the time-domain waveform and spectrum of a sine
wave applied to the Model 8968 High Resolution Unit.
To avoid imaging phenomena when analyzing waveforms with the FFT function,
verify the maximum sampling frequency of the module before measuring.
Spectral Imaging
Time-domain waveform
in the 8 MHz frequency range
(sampling frequency = 20 MHz)
Spectrum
The highest sampling frequency of the
Model 8968 is 1 MHz, so the same input
data value is used for each block of 20
samples, resulting in a stair-step wave-
form.
When FFT processing is performed on
a stair-step waveform, the resulting
spectrum shows non-existent compo-
nents.
In this case, the spectral components
above 1 MHz / 2 = 500 kHz are theoret-
ically meaningless.
Spectrum
Here, the frequency range matches the
sampling frequency of the Model 8968 so
no interpolation is performed on the time-
domain data.
Time-domain waveform
in the 400 kHz frequency range
(sampling frequency = 1 MHz)
100 200 300
400