MR8740、MR8741_user_manual_eng_20191016H.pdf - 第246页
10.2 Settings for Waveform Calcula tion 234 10.2.2 Setting const ant s Procedure To open th e screen : Right-clic k and select [ST A TUS] [Wave Calc] she et 1 Move the fl ashing cursor to th e No. to be set as [CONST .…
10.2 Settings for Waveform Calculation
233
9
Chapter 10 Waveform Calculation Functions
10
About calculation equations _____________________________________
Operators
See: "10.3 Waveform Calculation Operators and Results" (p.237)
Entering Calculation Equations
• Each entered calculation equation may contain up to 80 characters.
• Each constant in a calculation equation may contain up to 30 digits.
• For multiplication, use [*]. For division, use [/].
• Entering a long, complex formula such as that shown below will cause "?" to
be displayed. Separate the formula into two shorter formulas.
• When dividing by 0, an overflow value is output.
(For positive values, +9.9999E+29. For negative values, -9.9999E+29.)
• The result of calculation Z
i
can be used in other calculation equations. How-
ever, the Z
n
th equation can only refer to the results of equations up to Z
n-1
.
(Example: Equation Z
4
can include the results of equations Z
1
through Z
3
.)
Using the MOV, SLI, DIF and DIF2 operators in an equation
The number # after a comma within parenthesis (_,#) for each operation is set to
the calculation operator.
When calculation results overflow (OVER)
• The value that indicated by the A/B cursor is not a correct value.
• When [Scale] is set to [Auto], waveforms appear at the top or bottom edge of
the screen. This makes calculation result overflow obvious.
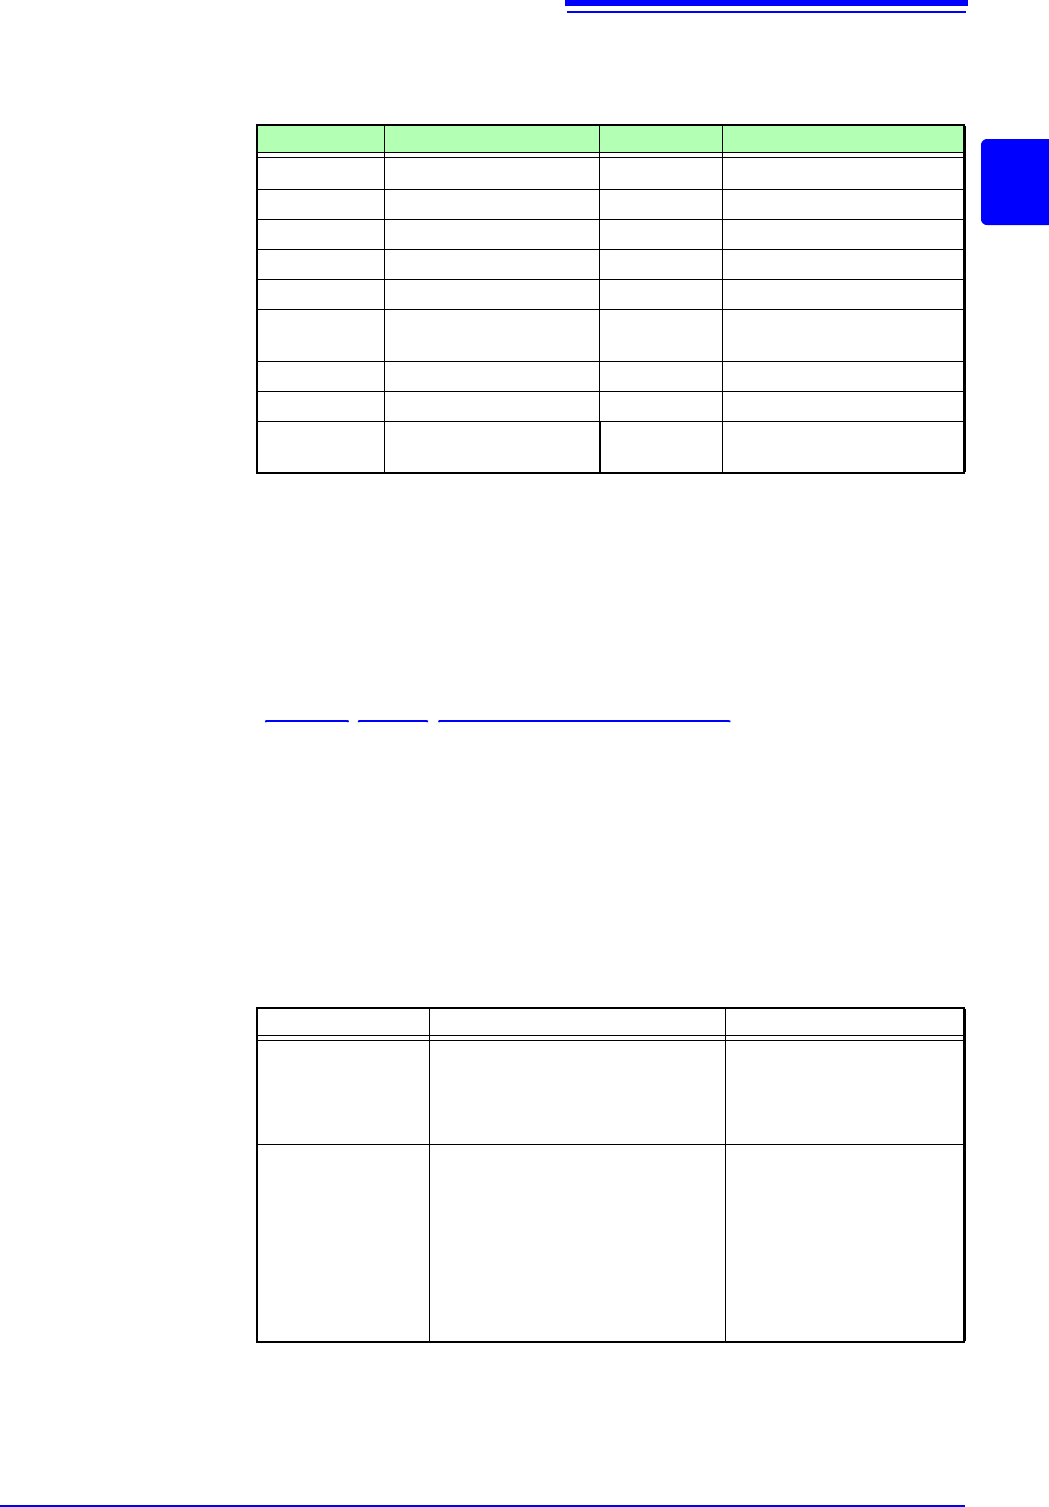
Operator Name Operator Name
ABS Absolute Value DIF2 2
nd
Derivative
EXP Exponent INT2 2
nd
Integral
LOG Common Logarithm SIN Sine
SQR Square Root COS Cosine
MOV Moving Average TAN Tangent
SLI Movement parallel to the
time axis
ASIN Inverse Sine
DIF 1
st
Derivative ACOS Inverse Cosine
INT 1
st
Integral ATAN Inverse Tangent
PLCS Digital Voltmeter Unit PLC de-
lay time shift
ABS(CH1)+CH2*CH3-(CH4+CH5)*ABS(CH4)/DIF(CH1, 1)
12 3
Operator Setting Choice Setting Examples
MOV
(Moving Average)
SLI
(Parallel Movement)
Set the number of points to move.
Setting Range
MOV (Moving Average): 1 to 5000
SLI: -5000 to 5000
Calculate the 10-point mov-
ing average of CH1:
MOV(CH1,10)
DIF
(Derivative)
DIF2
(2nd Derivative)
Specify the sampling interval for dif-
ferentiation.
"1" is normally acceptable, but this
should be set larger to capture fluc-
tuation values of slowly changing
waveforms.
DIF and DIF2 Setting Range: 1 to
5000
Differentiate CH2 using a 20-
point sampling interval:
DIF(CH2,20)

10.2 Settings for Waveform Calculation
234
10.2.2 Setting constants
Procedure
To open the screen: Right-click and select [STATUS] [Wave Calc] sheet
1
Move the flashing cursor to the No. to be set as
[CONST.].
2
Select an entry method, and enter the constant.
Setting range: -9.9999E+29 to +9.9999E+29
See: "7.1.3 Alphanumeric Input" (p.141)
Defined constants are shown in the constant display of the calcula-
tion equation setting dialog.
1
10.2 Settings for Waveform Calculation
235
9
Chapter 10 Waveform Calculation Functions
10
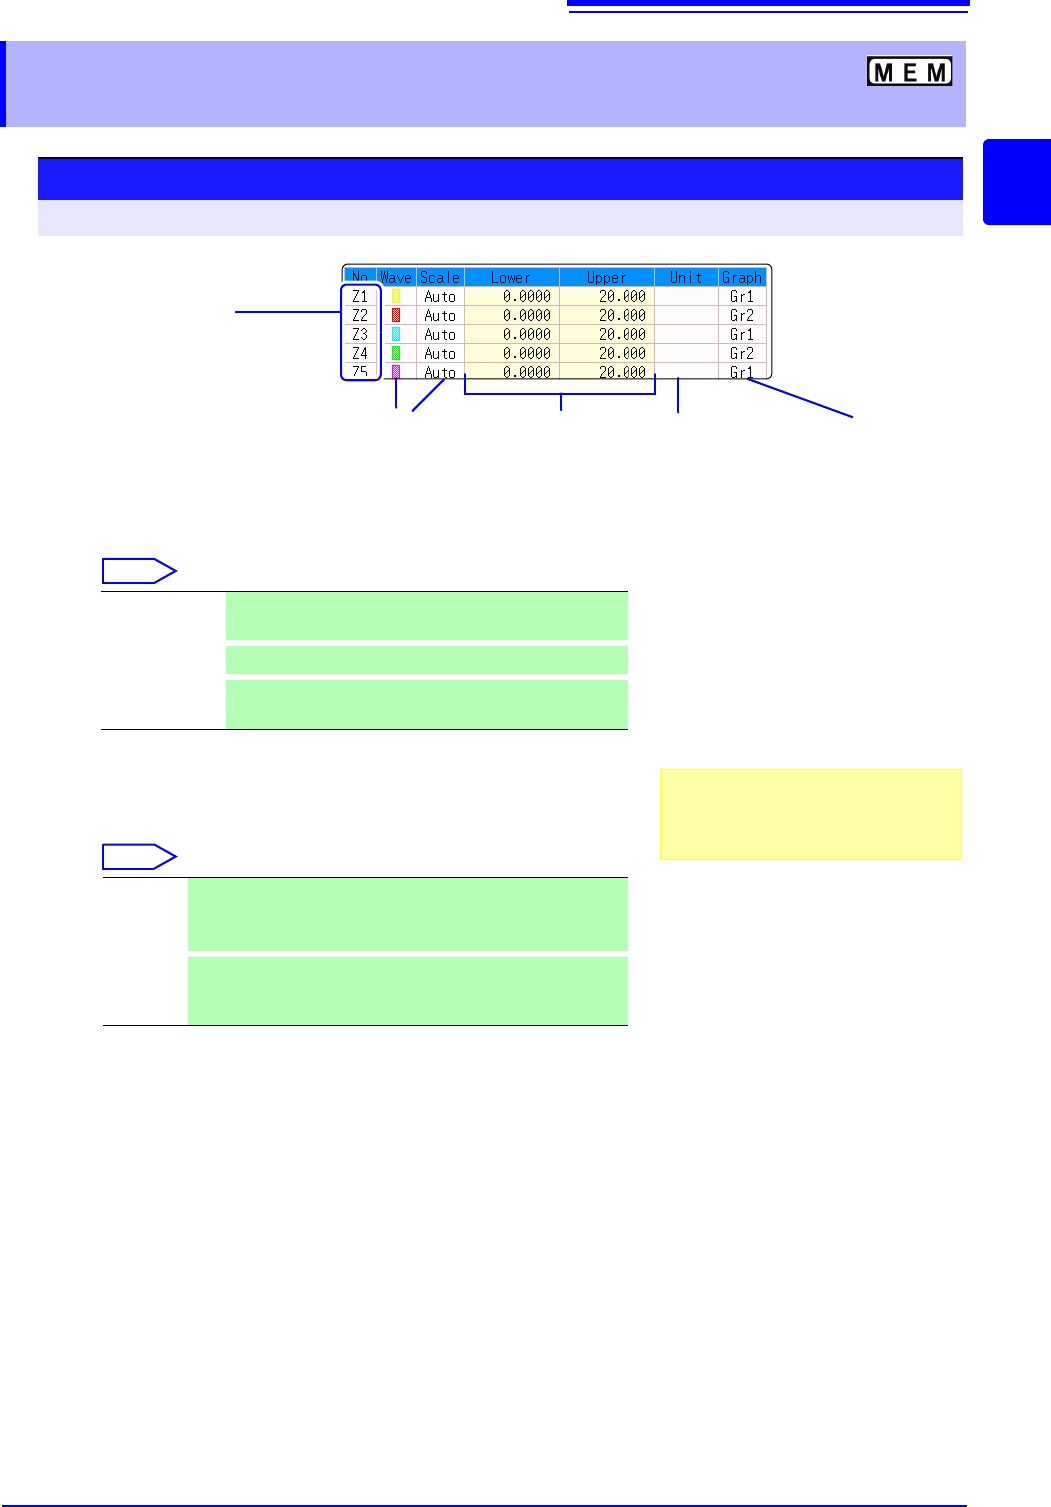
10.2.3 Changing the display method for calculated
waveforms
Procedure
To open the screen: Right-click and select [STATUS] [Wave Calc] sheet
1
Enable waveform display, and display color
Move the flashing cursor to the [Wave] column.
Select
2
Select a method to set scaling
Move the flashing cursor to the [Scale] column for the Calculation No.
to be set.
Select
3
Set the upper and lower limits of the display range (when
[Manual] is selected)
Select [Lower] and [Upper].
Select an entry method and enter the limit values.
Entry range: -9.9999E+29 to +9.9999E+29
See: "7.1.3 Alphanumeric Input" (p.141)
4
Specify the physical units
Move the flashing cursor to the [Unit] column.
Select an entry method and enter the physical units.
See: "7.1.3 Alphanumeric Input" (p.141)
5
Select the graph to be displayed.
(When split screen ([Format] item on the [Status] sheet) is
[Dual] or higher)
Move the flashing cursor to the [Graph] column and select the graph
b
Waveform
color
Upper and
lower limits
Displayed
measurement units
Display range
setting method
Calculation No.
To copy settings
between Calculation Nos.:
Click the calculation No.
12 43
Graph to
display
6
On-Off Set On to display the waveform of the flashing cursor
column (default setting). Set to Off to hide display.
Select the waveform color.
All On-Off
Select On to display all waveforms. Select Off to hide all
waveforms.
Auto Automatically sets the display range of the vertical axis. (After
calculation, the upper and lower limits are obtained from the
results, and set automatically.)
Manual
Upper and lower limits of the vertical axis display range are
entered manually.
A shorter calculation time than with Auto is possible.
Depending on calculation results, auto-
matic scaling settings may be unsatisfac-
tory, in which case the limits must be
entered manually.