MR8740、MR8741_user_manual_eng_20191016H.pdf - 第237页
9.5 Numerical Calculation Type and Description 225 Chapter 9 Numerical Calculat ion Functions 8 9 Time to Level (Time-Le v) Finds the point where the signal crosses a speci- fied level from the start of the calculation r…
9.5 Numerical Calculation Type and Description
224
Rise Time and
Fall Time
The rise time of the acquired waveform from
A% to B% (or fall time from B% to A%) is ob-
tained by calculation using a histogram (fre-
quency distribution) of the 0 and 100%
levels of the acquired waveform.
As waveform data is acquired, the rise time
(or fall time) is obtained from the first rising
(or falling) edge.
When calculation of the range specified by
the A/B cursors is selected, the obtained
rise time (or fall time) is the first rising (or
falling) edge between the cursors.
Standard Deviation
(Std Dev)
Obtains the standard deviation of the waveform data.
Area
Obtains the area value (V•s) enclosed by
the zero position (point of zero potential)
and the signal waveform.
When calculation of the range specified by
the A/B cursors is selected, the calculated
area is constrained to the waveform be-
tween the cursors.
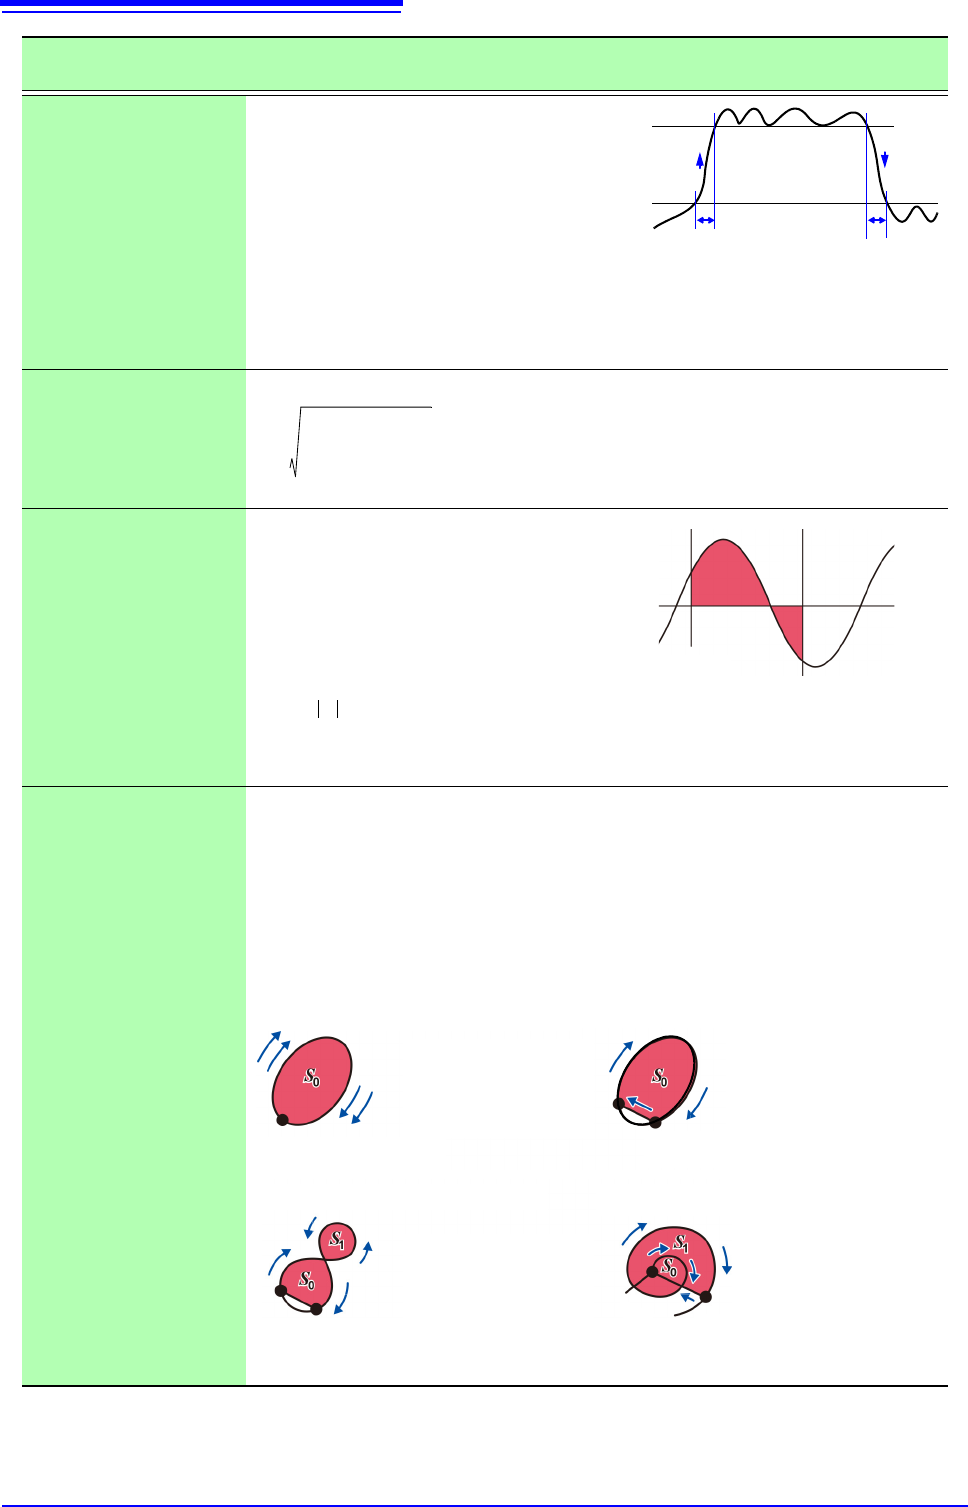
X-Y Area
Obtains the area (V
2
) of an X-Y composite waveform. In the following figures, the areas
within the lines are calculated. The calculation is available even if the X-Y composite
waveform is not intended for display.
To enable area calculation, specify the calculation range using the A/B cursors (Voltage
axis or Trace) on the waveform of each channel for X-Y composition. (The area cannot
be specified directly by A/B cursors on the X-Y waveform.)
See: About A/B Cursor:"6.1 Reading Measurement Values (Using the A/B Cursors)" (
p.120)
Setting Choices: Set the X- and Y-axis channels.
Numerical Calculation
Type
Description
Fall Time
Rise Time
B%
A%
A: 5 to 30%
B: 95 to 70%
1
n
---
di AVE–
2
i1=
n
=
: Standard Deviation
AVE: Average
n: Data count
di: Data on channel number i
A cursor
B cursor
Sdi
i1=
n
=h
S:Area
n: Data count
di: Data on channel number i
h=
t: Sampling rate
Start/end point
S = n × S
0
S:Area
n: Number of loops
When the trace consists of multiple
loops
When the trace is an open curve
End point
S = S
0
S:Area
(Area enclosed by the curve
and line connecting start
and end points)
Start
point
S = | S
0
- S
1
|
S:Area
When the trace is a figure-8 When the trace is an open curve
End
point
S = S
0
× 2 + S
1
S:Area
(The number of overlapping
regions increases with the
number of loops)
Start
point
End point
Start
point
9.5 Numerical Calculation Type and Description
225
Chapter 9 Numerical Calculation Functions
8
9
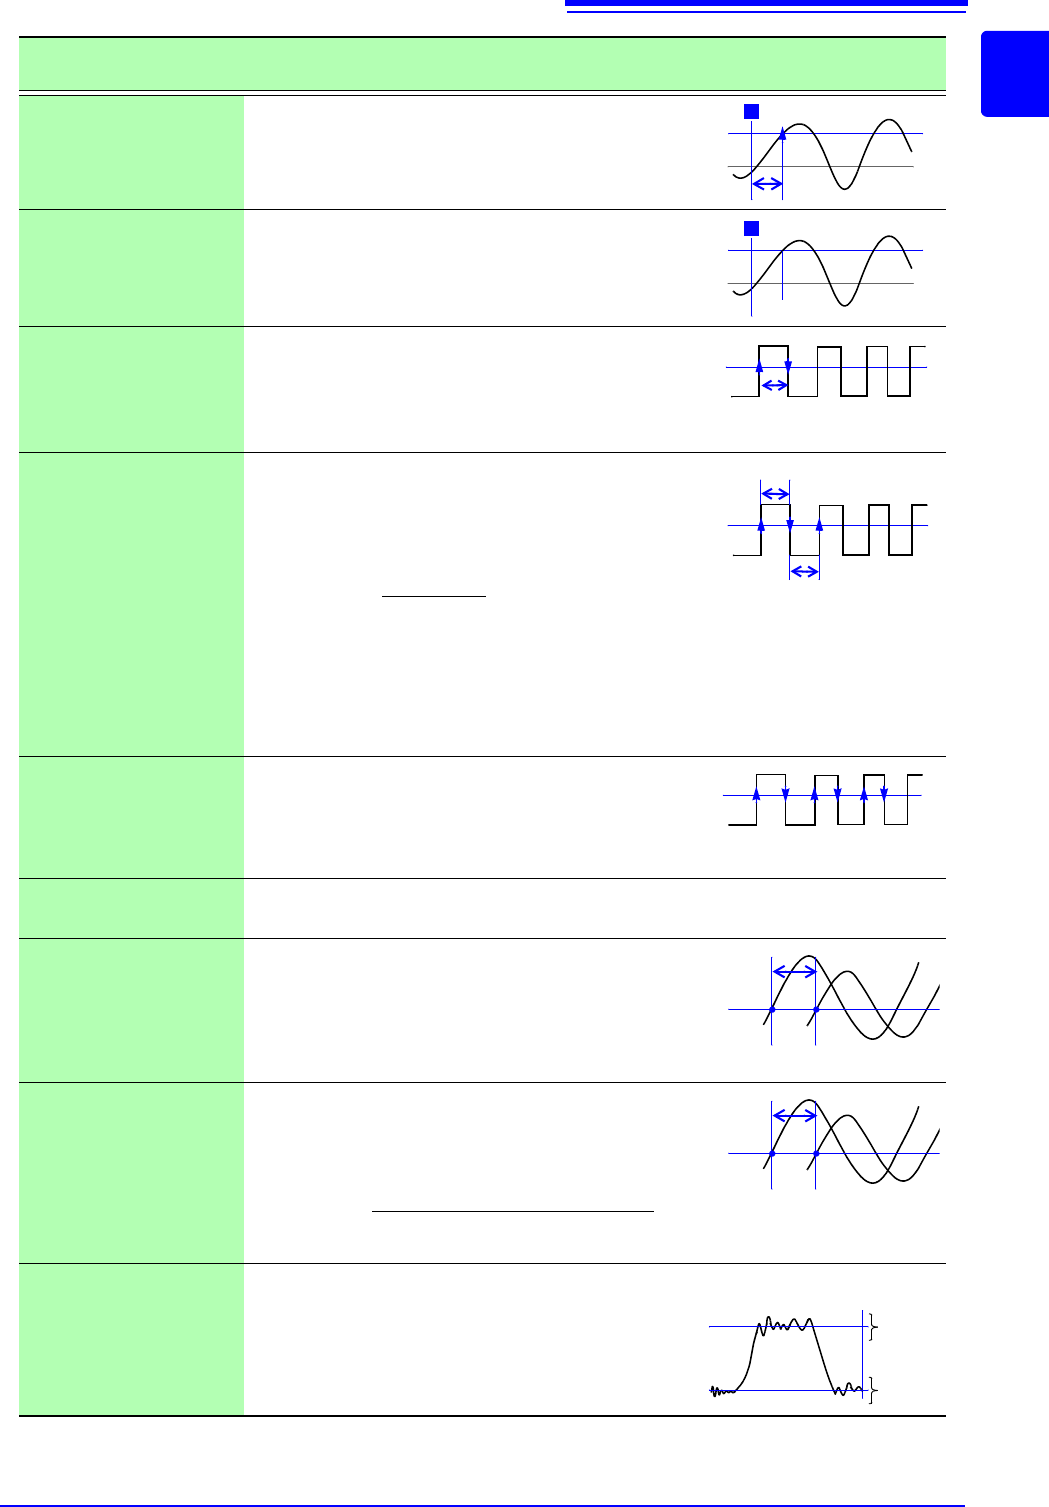
Time to Level
(Time-Lev)
Finds the point where the signal crosses a speci-
fied level from the start of the calculation range,
and obtains the time elapsed from the last trigger
event.
Specified Time Level
(Lev-Time)
Obtains the level at a specified time point after the
trigger event.
The time can also be specified using other calcu-
lation results obtained earlier.
Pulse Width
Obtains pulse width as the time difference be-
tween one rising or falling intersection of the wave-
form through a specified level to the next
intersection (with opposite slope).
Duty Ratio (%)
Obtains the duty percentage based upon the ratio
of the time from a rising intersection to the next
falling intersection at a specified level, to the time
from the same falling intersection to the next rising
intersection at the same level.
Pulses
Obtains the count of pulses from the number of ris-
ing or falling intersections with a specified level.
One pulse is counted when the signal falls back
below the specified level after rising through it (or
vice versa)
Four Arithmetic Oper-
ations (Calculation)
Performs arithmetic operations (+, - , ×, ÷) upon arbitrarily selected results of numerical
calculations.
Time difference calcu-
lation (Time Diff)
Obtain T[s], the time difference that passes be-
tween rises above or drops below the level speci-
fied for A and B waveforms.
Time difference T = B waveform (time where the
level was exceeded) - A waveform (time where the
level was exceeded).
Phase contrast calcu-
lation (Phase Diff)
Obtain the time difference that passes between
rises above or drops below the level specified for
A and B waveforms and then obtain the phase
contrast [°], based on A waveform.
High Level
Low Level
With 0% of the loaded waveform data as the Low
level and 100% as the High level, a histogram (fre-
quency distribution) is used for calculation.
Numerical Calculation
Type
Description
Level
0 V
T
Level
0 V
T
T (Time)
Level
Level
T
u-d
T
d-u
Duty (%) =
X 100 (%)
Tu-d
Tu-d + Td-u
T
u-d
: Time (seconds) after rising intersection to
falling intersection
T
d-u
: (s) Time (seconds) after falling intersection
to the next rising intersection
Level
0
123
Level
T
AB
Level
T
AB
Phase contrast=
× 360°
Cycle of A waveform
Time difference of A and B waveform [T]
0%
100%
Low
Level
High
Level
Data number

9.5 Numerical Calculation Type and Description
226