MR8740、MR8741_user_manual_eng_20191016H.pdf - 第285页
12.7 Analysis with the Waveform Screen 273 11 Chapter 12 FFT Function 12 The FFT function ca n specify the calculation star t position for waveforms measured by the memory function before ca lculation. Operation differs …
12.6 Saving Analysis Results
272
The saving procedure is the same as for the Memory function.
See: "Chapter 4 Saving/Loading Data & Managing Files" (p.83)
The size of saved files depends on the save format and analysis method.
See: "Appendix 2.1 Waveform File Sizes" (p.A2)
When FFT Analysis Results are Saved as Text
Divide files by calculation item and then save.
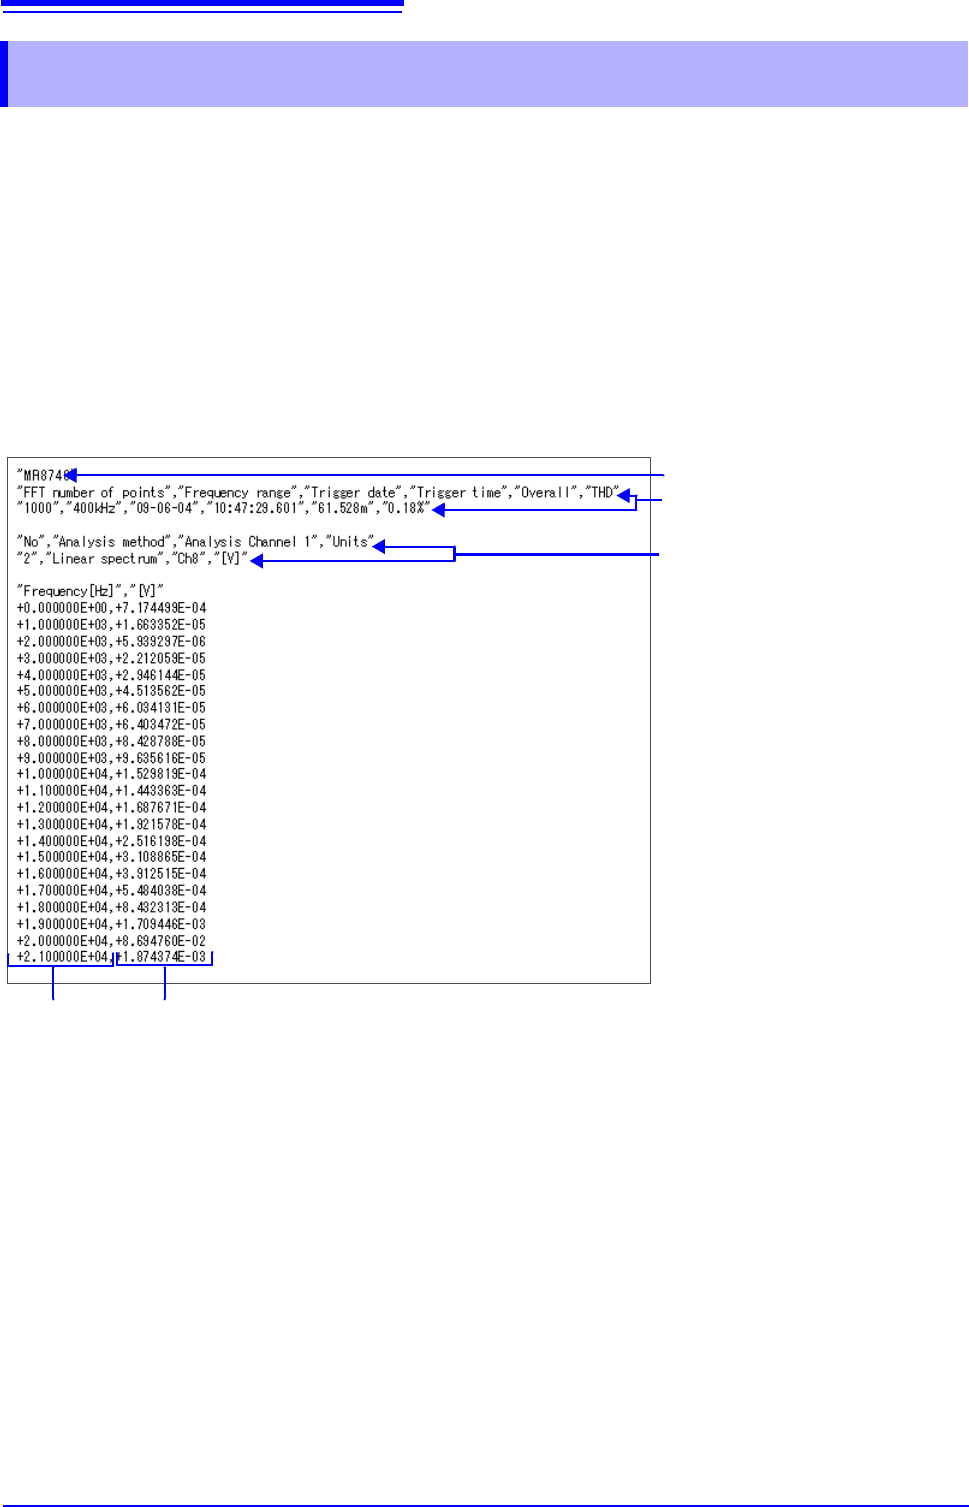
Text Saving Example
12.6 Saving Analysis Results
Line 1: Title comment
Lines 2 to 3: Trigger Time
Calculation information
X-axis data Y-axis data
12.7 Analysis with the Waveform Screen
273
11
Chapter 12 FFT Function
12
The FFT function can specify the calculation start position for waveforms measured by the memory
function before calculation.
Operation differs by calculation execution settings.
See:"Trigger Modes and Averaging" (p.258)
•Calculation execution: [Single]
Analysis is performed once on the specified number of analysis points beginning with the specified
starting point, and analysis results are displayed.
This is convenient for analyzing only a specific range. However, if averaging is enabled, analysis
repeats for the specified averaging count.
•Calculation execution: [Repeat]
Analysis is performed repeatedly on the specified number of analysis points beginning with the speci-
fied starting point and ending with end of waveform data, and final analysis results are displayed
(Calculation is performed for the number of specified points so a good end point becomes the final
analysis result.)
Verifying the analysis starting point while viewing analysis data
12.7 Analysis with the Waveform Screen
12.7.1 Analyzing after Specifying an Analysis Starting
Point
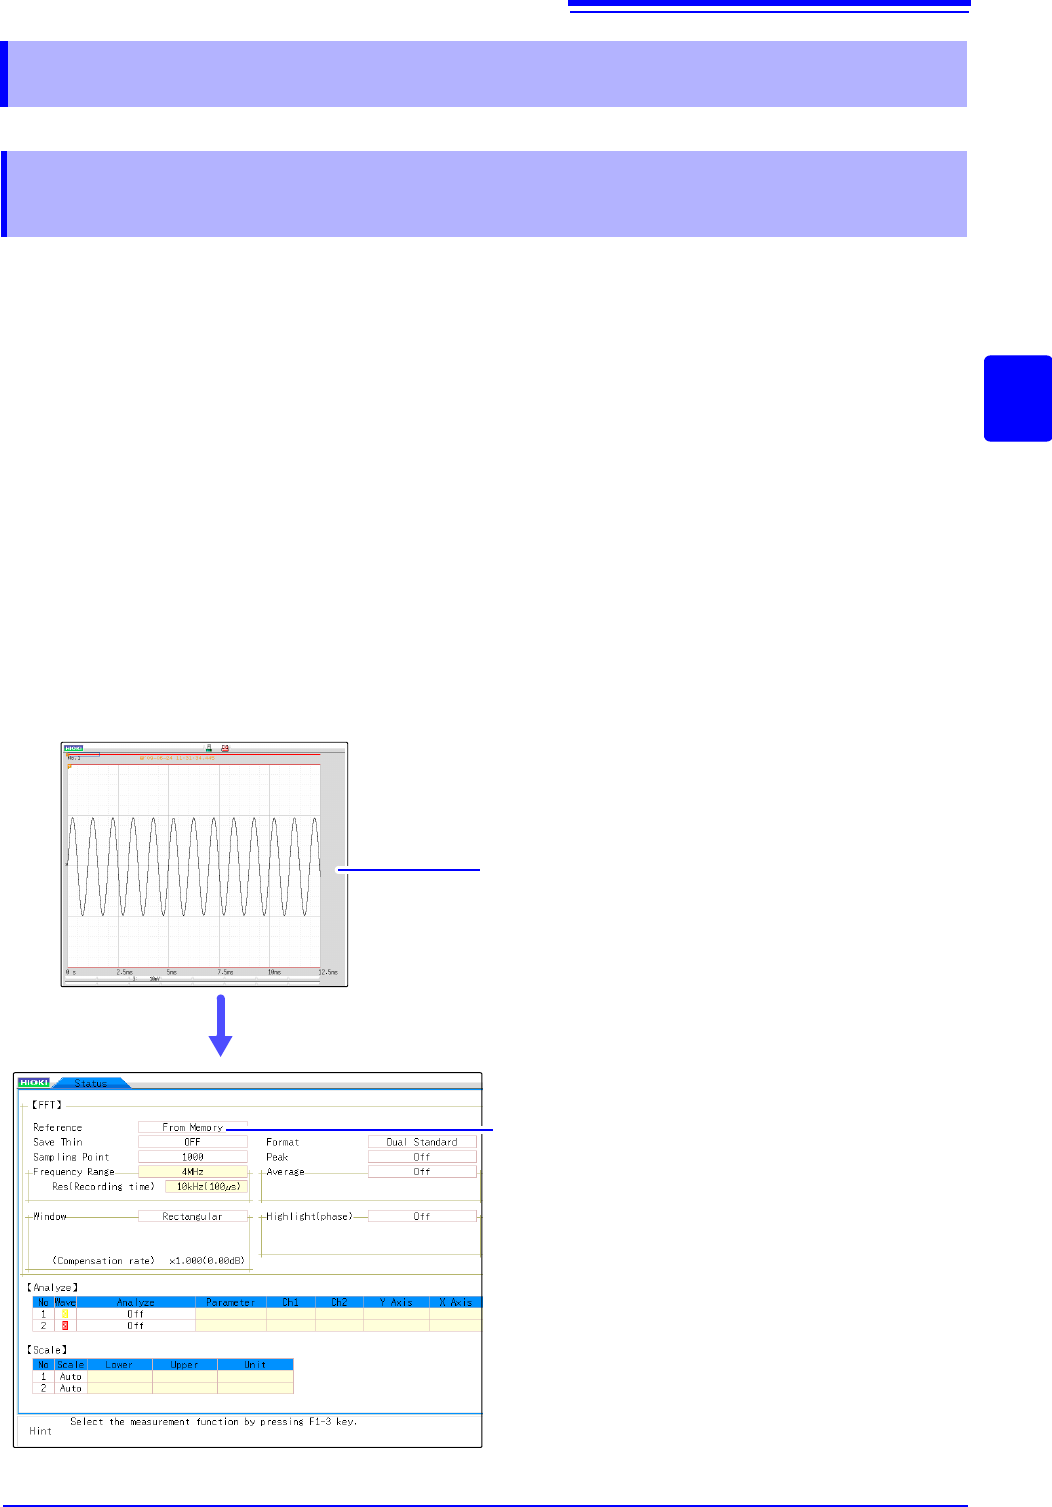
Display the waveform with the Memory func-
tion.
Set the [Reference] item to [From Memory].
Set analysis conditions such as the analysis mode and
number of analysis points (these can also be set on the
Waveform screen).
Click [DISP] in the right-click menu to display
the Waveform screen.
The one-time calculation range is displayed for the mem-
ory waveform.
1
Click [STATUS] in the right-click menu to display the [Status] sheet of
the Status screen.
4
3
Switch to FFT function.
2
5
12.7 Analysis with the Waveform Screen
274
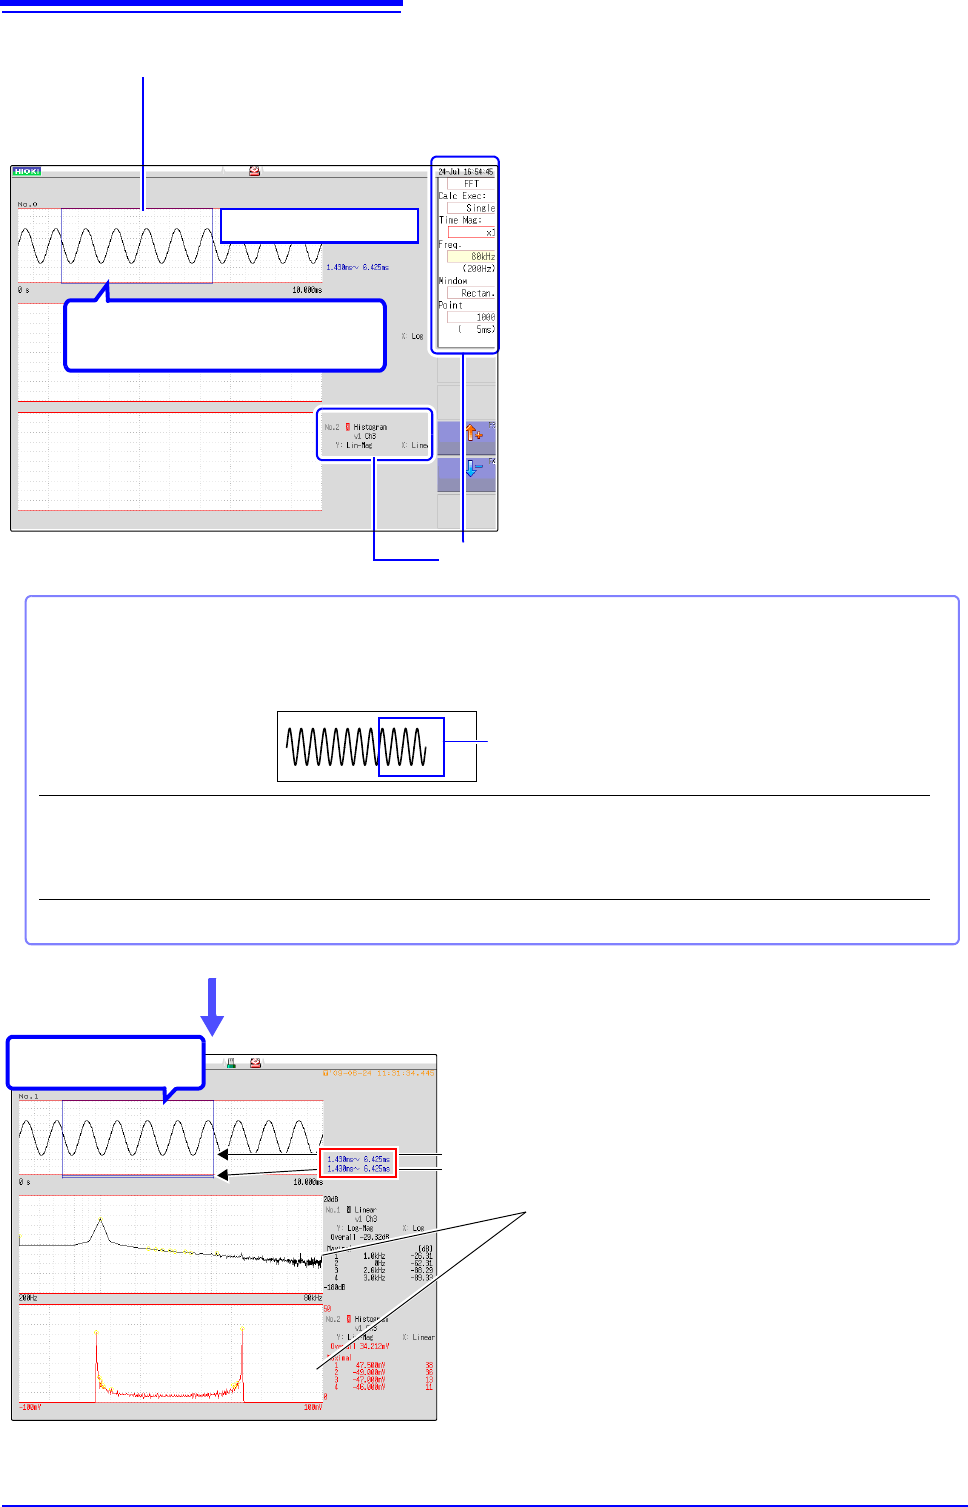
Use the mouse to move the memory waveform portion in order to
specify the calculation range, and then rotate the mouse wheel to
move the calculation range in order to specify the calculation
position.
To change the number of
analysis points
The setting can be changed at the top of the Waveform screen.
The range is determined by the number of analysis points.
If the analysis range (number of points) is larger than the memory waveform as
shown below, analysis is not performed.
To analyze only a certain
portion
If [Exec] is [Single] in the setting items at the right side of the screen, only the cal-
culation range currently displayed can be calculated.
For settings other [Single], calculation points are calculated until the final data.
To stop mid-way, click [STOP].
Analysis Segment Display
6
Select analysis conditions as occasion
demands.
The analysis segment of the memory
waveform for one pass is displayed.
Memory Waveform
7
Analysis results are displayed on the lower graphs.
When the trigger mode is [Auto] or [Repeat], the num-
ber of analysis points up to the end of the waveform
data is analyzed, and the last data is displayed.
Calculation range (portion in square)
Last range calculated (line portion)
Click [Exec] or [START] to perform analysis.
8
Analysis Starting
Point