MR8740、MR8741_user_manual_eng_20191016H.pdf - 第272页
12.3 Setting FFT Analysis Conditio ns 260 Select the type of FFT analysis, channel(s), waveform displa y color and x and y axes. 12.3.9 Analysis Mode Settings 1 Select the FFT analysis mode. Move the flashing cursor to t…
12.3 Setting FFT Analysis Conditions
259
11
Chapter 12 FFT Function
12
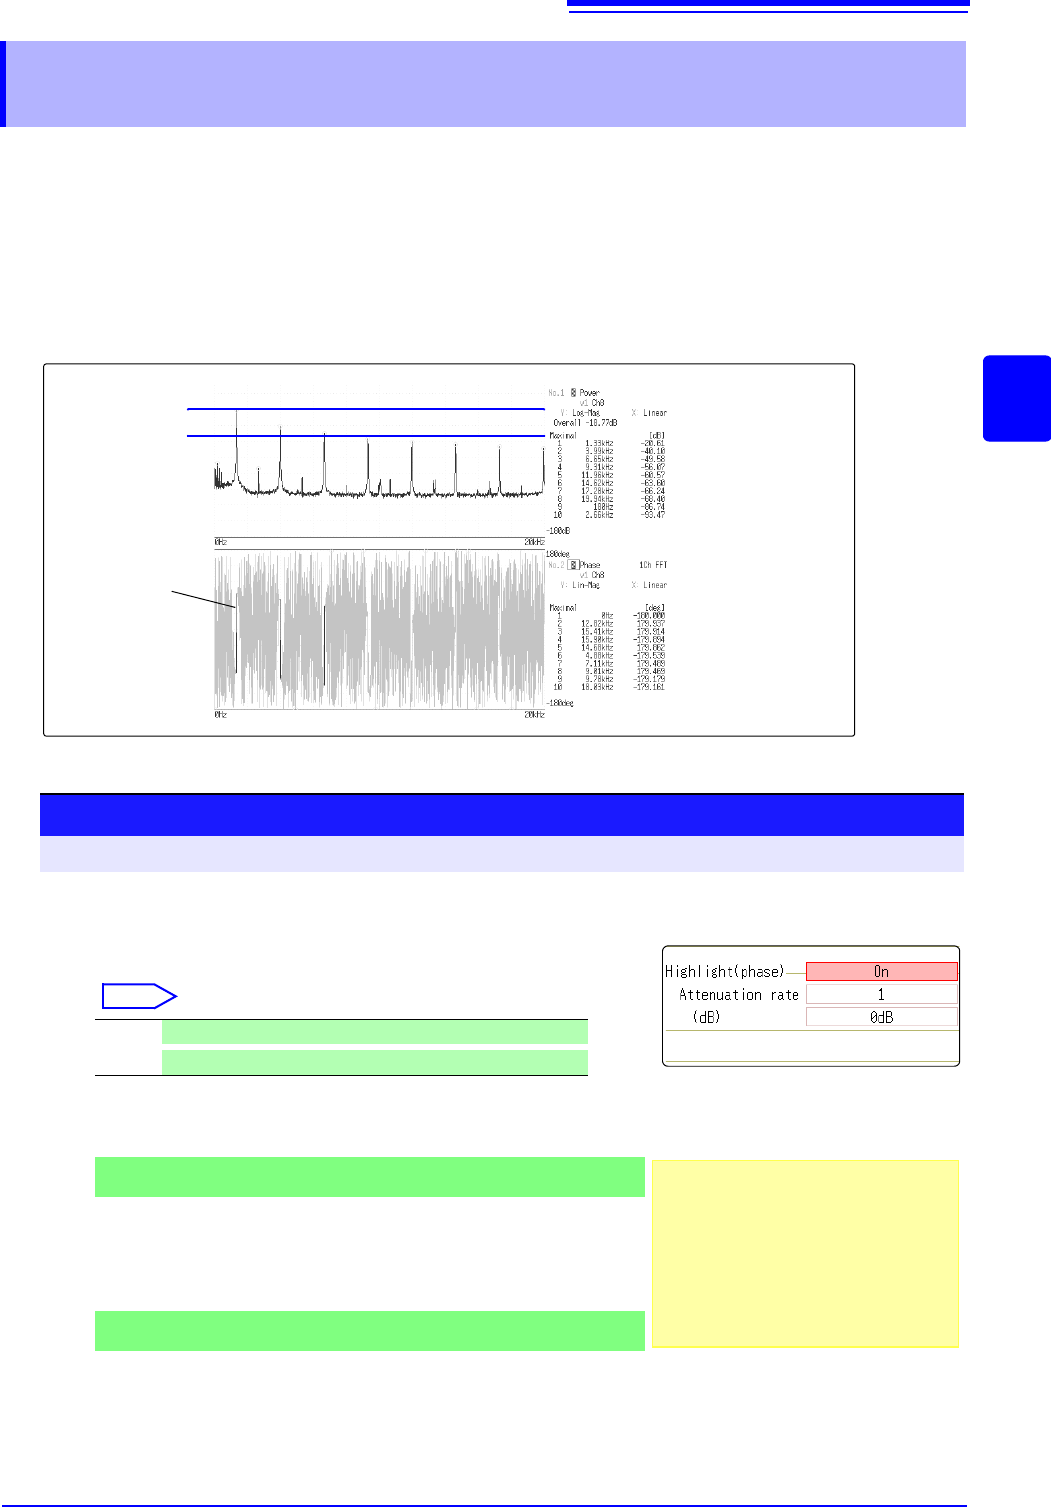
By specifying a setting factor (rate) to be applied to the input signal, the display of data exceeding the result-
ing threshold can be emphasized. This feature is useful for viewing waveforms that may otherwise be
obscured by noise.
The reliability of phase spectrum values is poor when discrete Fourier transform values are extremely small.
For example, in the case of a pure sine wave, almost all phase values at frequencies other than the input fre-
quency result from calculation errors. By treating the maximum value of the power (or cross-power) spectrum
of the input signal,
P
max
, as a reference value, data that exceeds that value multiplied by rate R can be dis-
played with emphasis.
12.3.8 Emphasizing Analysis Results (phase spectra
only)
Power Spectrum
Phase Spectrum
Emphasis
Display
10logP
max
[dB]
10logRP
max
[dB]
Attenuation Rate and Value
Attenuation value: A [dB]
Attenuation rate: R
-A = 10log
10
R
1 x 10
-6
R 1
0
A 60
1
Enable the highlighting function.
Move the flashing cursor to the [Highlight(phase)] item.
Select
2
Set the attenuation rate or attenuation value.
To set an attenuation rate
Move the flashing cursor to the [Attenuation rate] item.
Enter the attenuation rate.
See: "7.1.3 Alphanumeric Input" (p.141)
To set an attenuation value [dB]
Move the flashing cursor to the [(db)] item.
Enter the attenuation value.
See: "7.1.3 Alphanumeric Input" (p.141)
Off Emphasis display disabled. (default setting)
On
Emphasis display enabled.
Procedure
To open the screen: Right-click and select [STATUS] [Status] sheet
1
2
3
12.3 Setting FFT Analysis Conditions
260
Select the type of FFT analysis, channel(s), waveform display color and x and y axes.
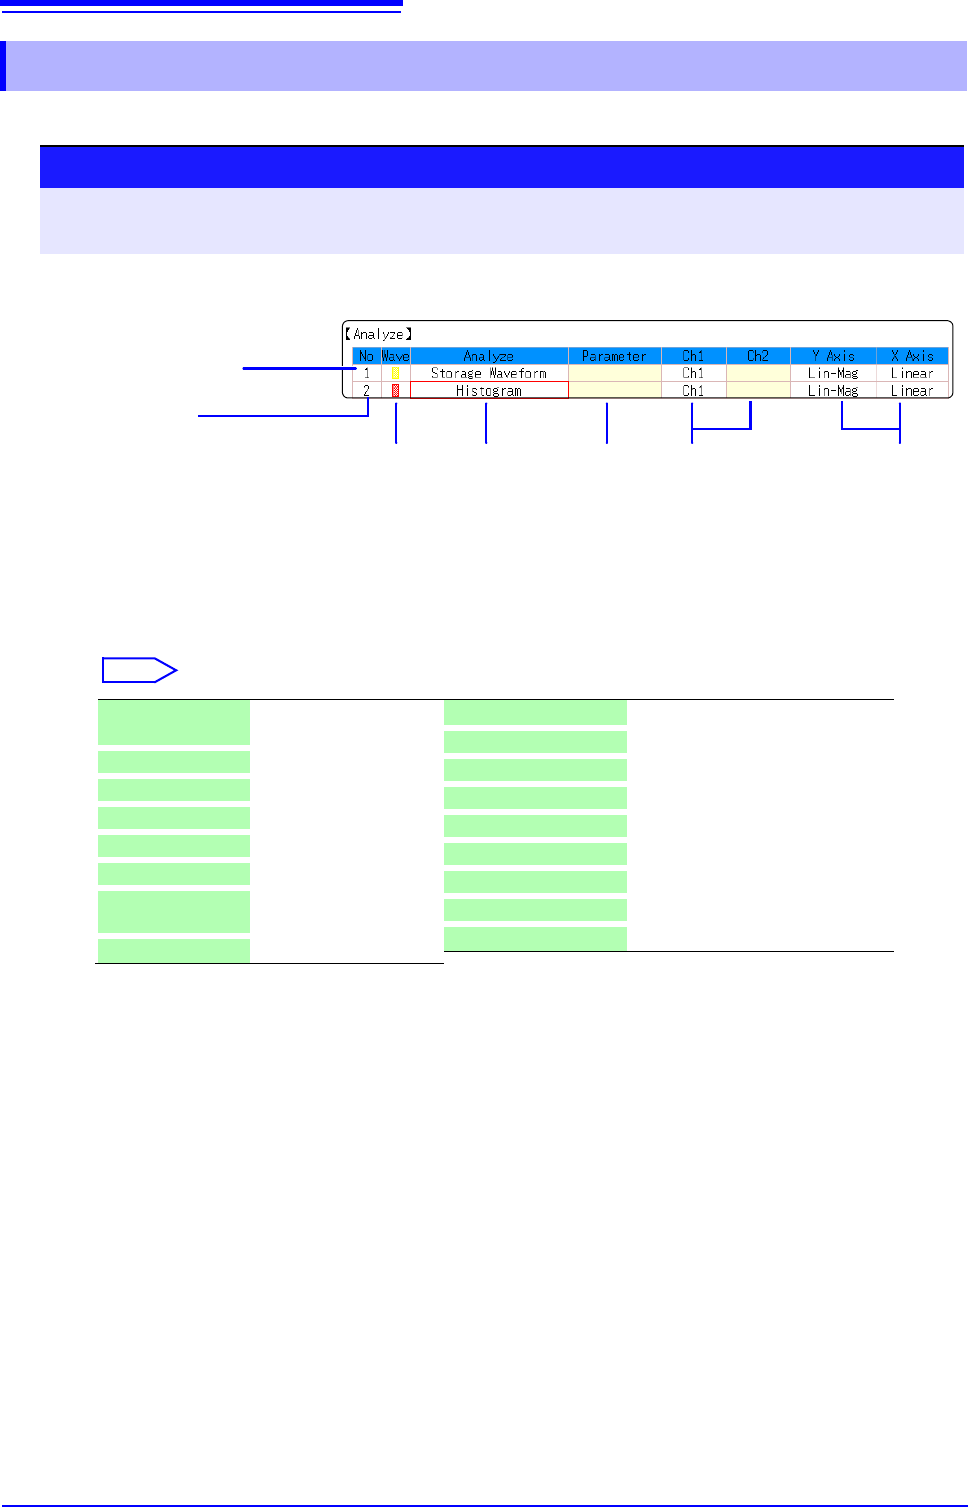
12.3.9 Analysis Mode Settings
1
Select the FFT analysis mode.
Move the flashing cursor to the [Analyze] column of the Analysis No.
to se
t.
Select
(When [List] is selected, a list of calculation types appears.)
2
Select whether to display the waveform, and its color.
Move the flashing cursor to the [Wave] column.
Select whether the waveform is to be displayed (On) or not, and its
color if displayed.
Analysis No.
Settings can be made from the
dialogs, or copied from another
Analysis No. (p.160)
Analysis
Type
1
2
Analysis Setting
Contents
Channel for
Analysis
34 5
Display
Color
X/Y Axes
Display
Parameter
Off No analysis.
(default setting)
Storage Waveform (p.275)
Histgram (p.275)
Linear Spectrum (p.276)
RMS Spectrum (p.277)
Powre Spectrum (p.279)
Powre Spectrum
density*
(p.280)
LPC (density)* (p.281)
Transfer Function (p.282)
Cross Power Spectrum (p.283)
Impulse Response (p.284)
Coherance Function (p.285)
Phase Spectrum (p.286)
Auto-Correlation (p.287)
Cross-correlation (p.288)
1/1 Octave* (p.288)
1/3 Octave* (p.288)
*Not available with external sampling enabled.
See: "12.8.2 Analysis Mode Functions" (p.293)
Procedure
To open the screen: Right-click and select [STATUS] [Status] sheet
See: To set from the Waveform screen (p.265)
12.3 Setting FFT Analysis Conditions
261
11
Chapter 12 FFT Function
12
3
When [Parameter] setting contents are displayed
Set the parameter.
Move the flashing cursor to the
[Parameter] column of the Anal-
ysis No. to set.
Select
4
Select the channel for analysis.
Move the flashing cursor to the [Ch1] item.
Select which channel number to use. However, the channel of
MR8990 Digital Voltmeter Unit cannot be set.
5
Set the horizontal and vertical axes displaying the calcu-
lation results.
Move the flashing cursor to the
[X Axis] or [Y Axis].
Set the contents of the calculation results to be displayed on
the horizontal and vertical axes.
(Selectable display contents vary by analysis mode.)
See: "Analysis Modes and X/Y Axis Display" (p.262)
Y-axis display
X-axis display
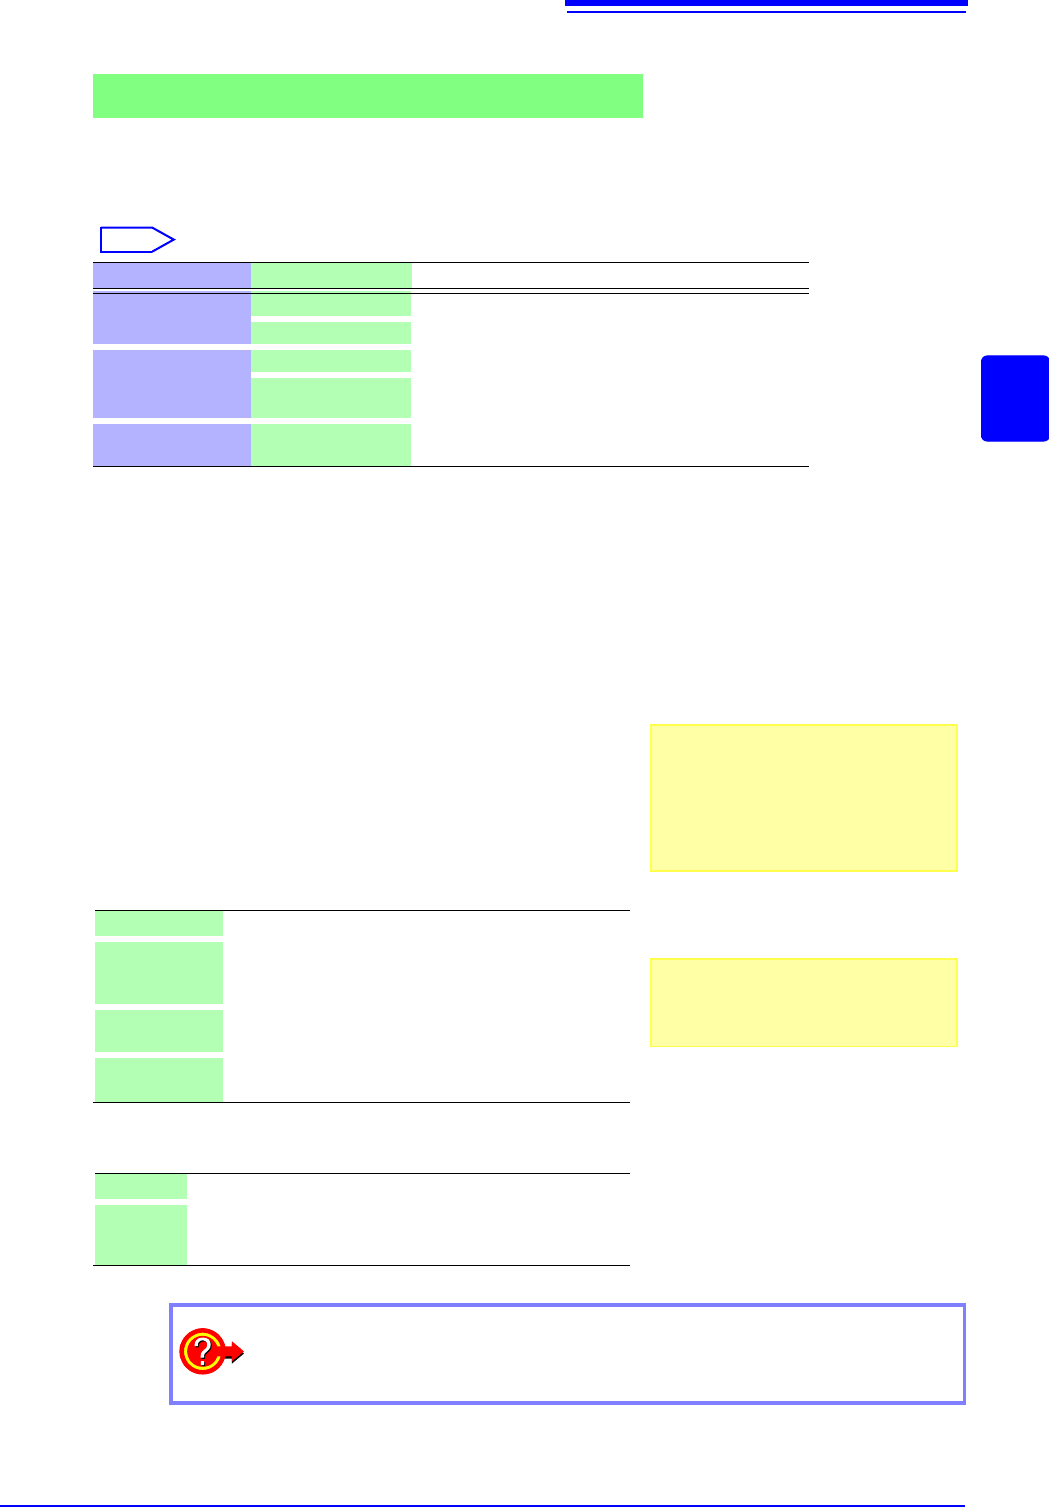
Analyze Parameter Setting Contents
1/1 Octave,
1/3 Octave
Filter: Normal
nables the octave filter.
See: "Octave Filter Setting" (p.262)
Filter: Sharp
Phase Spectrum
1ch FFT Calculates the phase of [Ch1].
2ch FFT Calculates the phase difference between [Ch1] and
[Ch2].
LPC (dencity)
Order :2 to 64 Larger numerical values make finer spectrum compo-
nents visible.
Lin-Mag Analysis results are displayed as amplitude values.
Log-Mag Analysis results are displayed as dB values.
The dB reference is 1 eu. (As a voltage example, 1 V is
0 dB.)
Lin-Real The real-number component of analysis results are dis-
played.
Lin-Imag The imaginary component of analysis results are dis-
played.
Linear Frequency-axis is displayed linearly.
Log Frequency-axis is displayed logarithmically.
This is convenient when the data of interest is at the lower end
of the frequency range, such as for sound and vibration.
Analysis channel setting
For any of the following analysis modes,
set both channels 1 and 2.
Transfer Function, Impulse Response,
Cross-correlation Function, Cross Power
Spectrum, Coherence Function, Phase
Spectrum (2ch FFT)
To analyze using external sampling
The horizontal axis ( x-axis) displays the
number of data points.
How do I copy settings to other calculation No.?
See: "7.8 Copying settings to other channels (calculation No.) (Copy function)" (p.160)