MR8740、MR8741_user_manual_eng_20191016H.pdf - 第301页
12.8 FFT Analysis Modes 289 11 Chapter 12 FFT Function 12 Oct ave Analysis Octave analysis consists of frequen cy analysis of the signal passed throug h a constant-width ba nd-pass filter. The power spectrum displays t…
12.8 FFT Analysis Modes
288
Waveform Example
Waveform Example
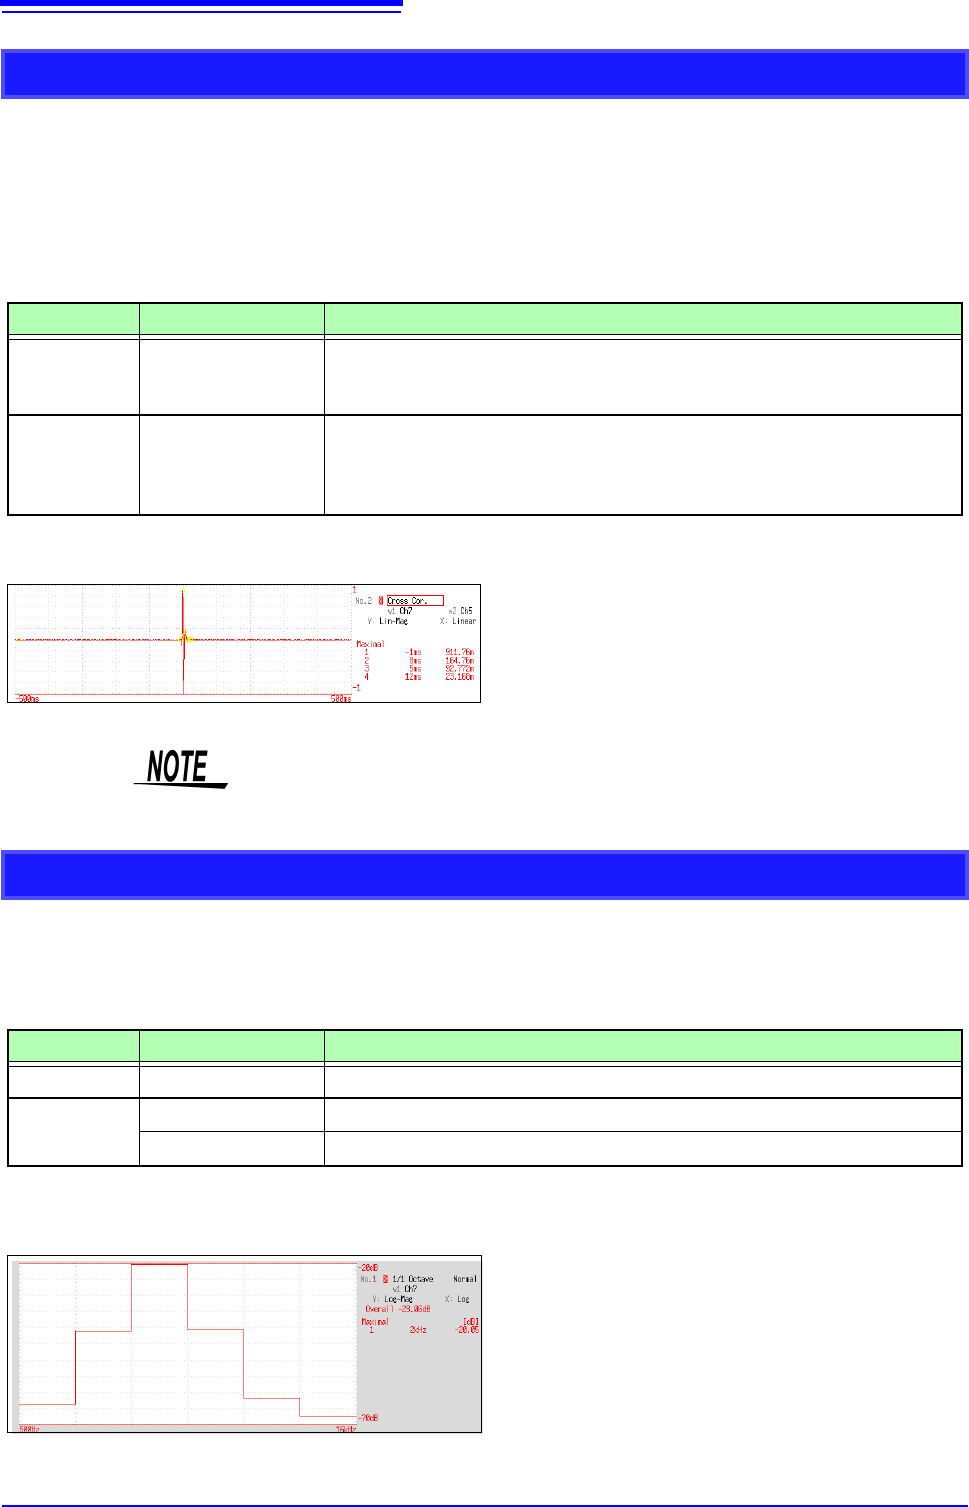
Cross-Correlation Function
Using two input signals, shows the correlation of two points on the input signal at time differential t.
Output is displayed as a function of differential time t.
Main uses:
• To determine the phase shift of two signals per unit of time
• To determine the speed and distance of time lag between two signals
See: About the Functions"12.8.2 Analysis Mode Functions" (p.293)
Axis Display Type Description
X axis Linear
Time display
The center (t = 0) is the reference. To the right is lag time (+t), and to the left is
lead time (-t)
Y axis Lin-Mag
+1 to -1 is displayed in dimensionless units.
At time differential t, this value is +1 when the correlation of input and output sig-
nals is the closest, and 0 when correlation is the least. -1 indicates completely
reversed polarity.
X axis: Linear
Y axis: Lin-Mag
This instrument provides a circular cross-correlation function.
Analysis results are normalized to the maximum value.
1/1 and 1/3 Octave Analysis
Analyze spectrums such as noise using fixed rate spectrum filters of 1/1 octave band or 1/3 octave band.
Main uses:
To analyze noise frequency
See: About the Functions"12.8.2 Analysis Mode Functions" (p.293), "Octave Filter Characteristics" (p.25)
Axis Display Type Description
X axis Log
Displays the center frequency of each band.
Y axis
Lin-Mag
Octave analysis values are displayed linearly.
Log-Mag
Octave analysis values are displayed as dB values. (0 dB reference value: 1eu)*
* eu: engineering units that are currently set are the standard (e.g., when the unit settings is volts, 0 dB = 1 V)
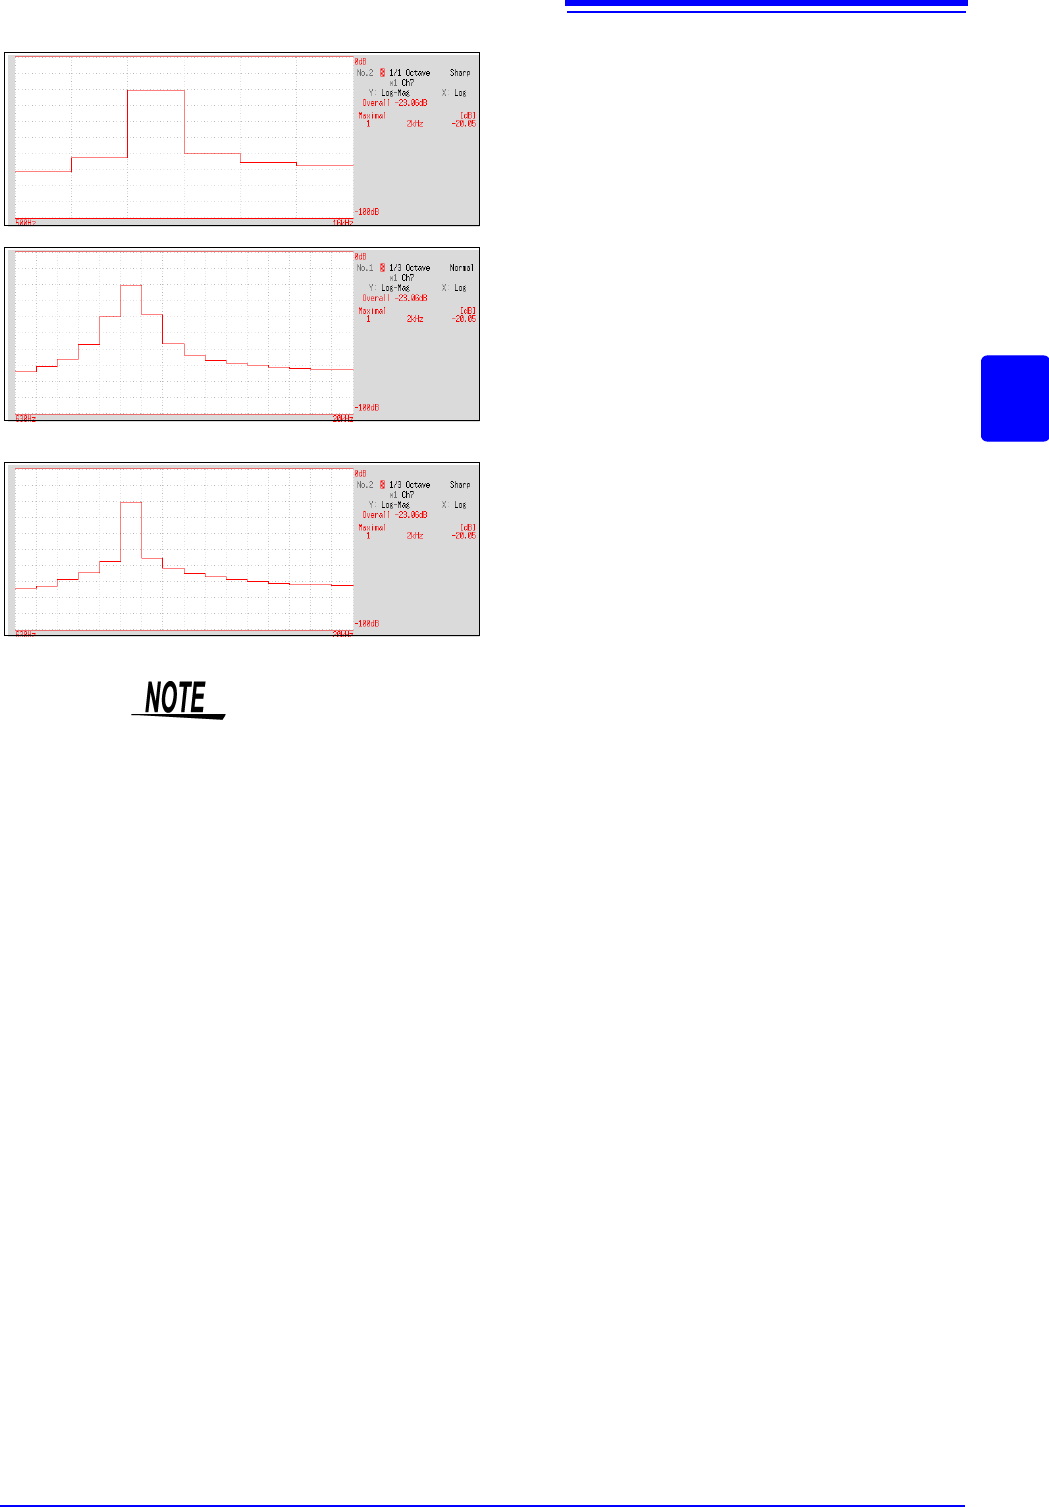
1/1 Octave
X axis: Log
Y axis: Log-Mag
Filter: Normal
12.8 FFT Analysis Modes
289
11
Chapter 12 FFT Function
12
Octave Analysis
Octave analysis consists of frequency analysis of the signal passed through a constant-width band-pass filter.
The power spectrum displays the power level in each subband after dividing the spectrum into fixed-width
segments (subbands), while octave analysis scales the spectrum logarithmically and displays each octave
(subband) as a bar graph.
The center frequency of the octave bands and filter characteristics are determined according to IEC61260
standards. With this instrument, 1/1- and 1/3-octave analyses are calculated using power spectrum Analysis
results.
1/1 Octave Analysis: 6 subbands
1/3 Octave Analysis: 16 subbands
The octave analysis results of this unit are displayed based on the oscillation level as a reference. Therefore,
when only sine waves are input, the value doubles (3.01 dB) versus the overall value. To directly read by
energy base, adjust the level by the setting scaling in advance.
See: "7.4 Converting Input Values (Scaling Function)" (p.148)
1/1 Octave
X axis: Log
Y axis: Log-Mag
Filter: Sharp
1/3 Octave
X axis: Log
Y axis: Log-Mag
Filter: Normal
1/3 Octave
X axis: Log
Y axis: Log-Mag
Filter: Sharp
Not available with external sampling enabled.
12.8 FFT Analysis Modes
290
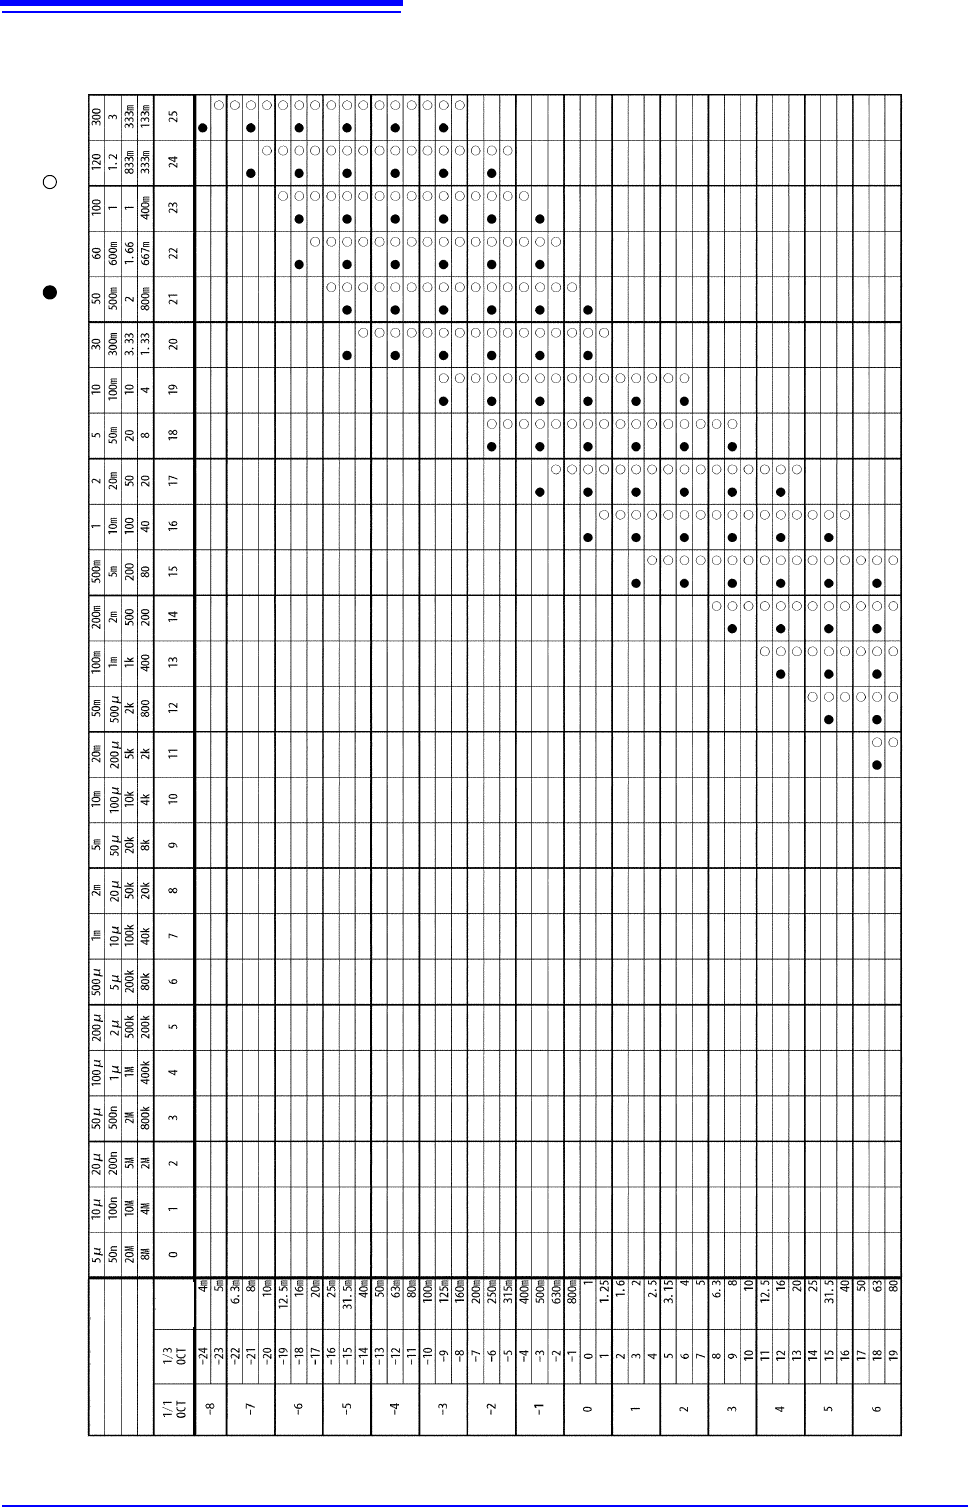
Measurable Ranges with Octave Analysis
Timebase
Period [s]
Sampling frequency [Hz]
Frequency range [Hz]
Center
[Hz]
( : 1/1 OCT, : 1/3 OCT)
frequency