MR8740、MR8741_user_manual_eng_20191016H.pdf - 第291页
12.8 FFT Analysis Modes 279 11 Chapter 12 FFT Function 12 W aveform Example Power Spectrum Displays input signal powe r as the amplitude component. Main uses : • T o inspect the peak frequency conten ts of a waveform • T…
12.8 FFT Analysis Modes
278
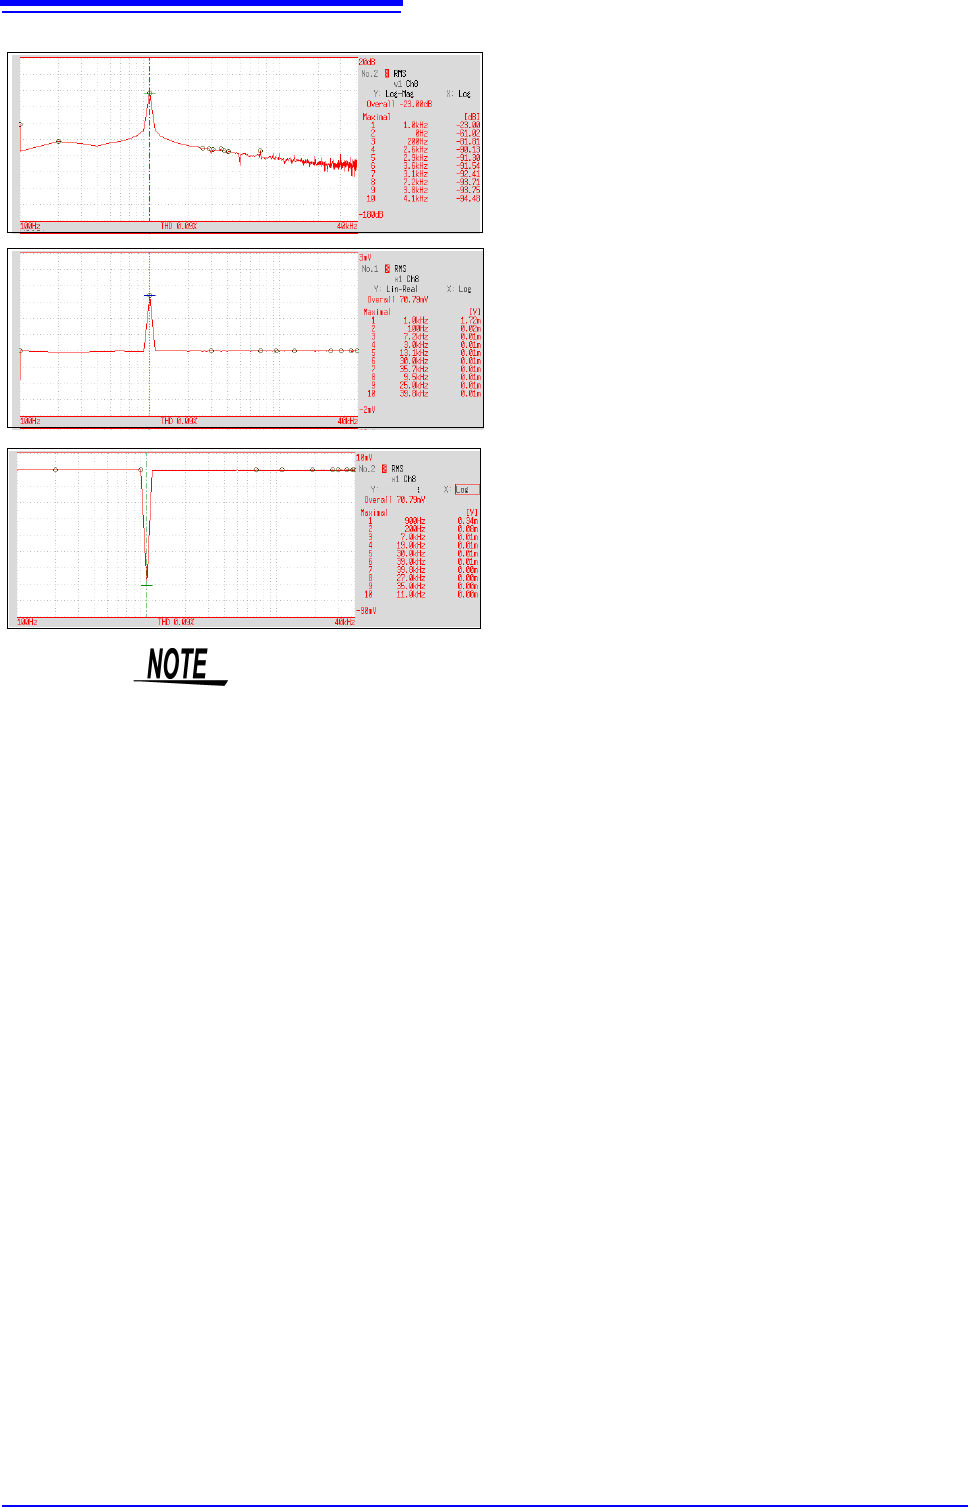
Normal display
X axis: Log
Y axis: Log-Mag
Normal display
X axis: Log
Y axis: Lin-Real
Normal display
X axis: Log
Y axis: Lin-Imag
Lin-Imag
If the cursor is displayed, the total harmonic distortion (THD), which sets the fun-
damental wave as the cursor position, is displayed.
When two cursors appear, A cursor is the fundamental wave.
When results cannot be obtained, [---%] is displayed.
12.8 FFT Analysis Modes
279
11
Chapter 12 FFT Function
12
Waveform Example
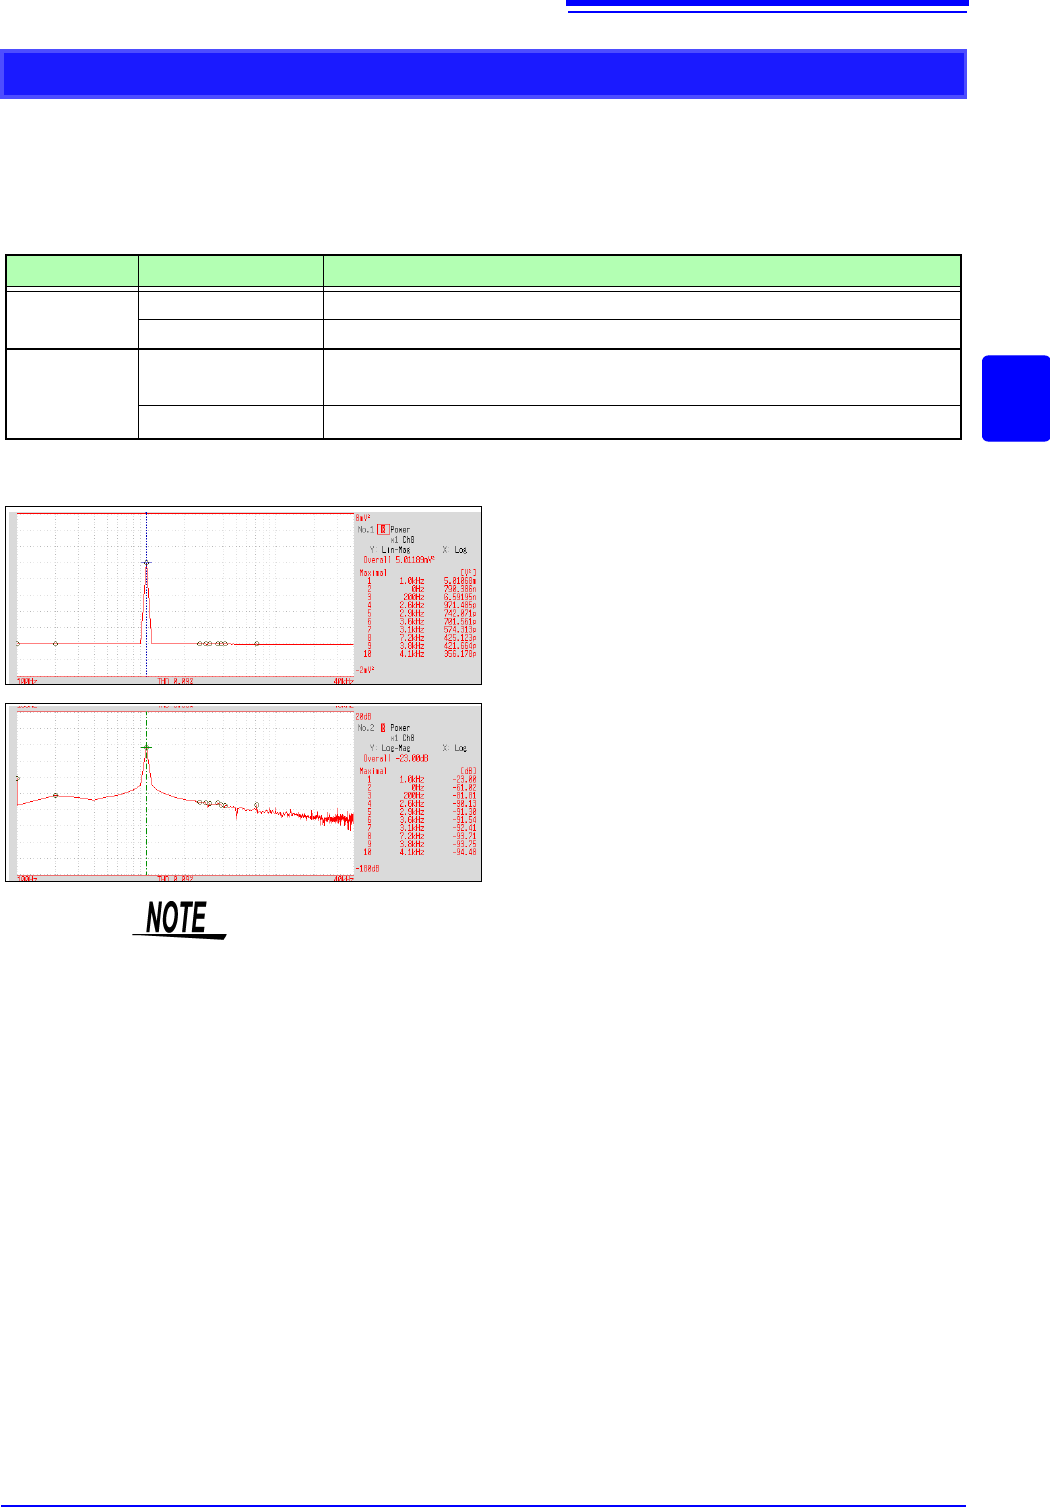
Power Spectrum
Displays input signal power as the amplitude component.
Main uses:
• To inspect the peak frequency contents of a waveform
• To inspect the power level at each frequency
See: About the Functions"12.8.2 Analysis Mode Functions" (p.293)
Axis Display Type Description
X axis
Linear Frequency is displayed with equal spacing
Log Frequency display of logarithm interval
Y axis
Lin-Mag
Analysis data is displayed linearly as squared values. Indicates the power com-
ponent.
Log-Mag(logarithm)
Analysis values are displayed as dB values. (0 dB reference value: 1eu
2
)*
* eu: engineering units that are currently set are the standard (e.g., when the unit settings is volts, 0 dB = 1 V
2
)
Normal display
X axis: Log
Y axis: Lin-Mag
Normal display
X axis: Log
Y axis: Log-Mag
If the cursor is displayed, the total harmonic distortion (THD), which sets the fun-
damental wave as the cursor position, is displayed.
When two cursors appear, A cursor is the fundamental wave.
When results cannot be obtained, [---%] is displayed.
12.8 FFT Analysis Modes
280
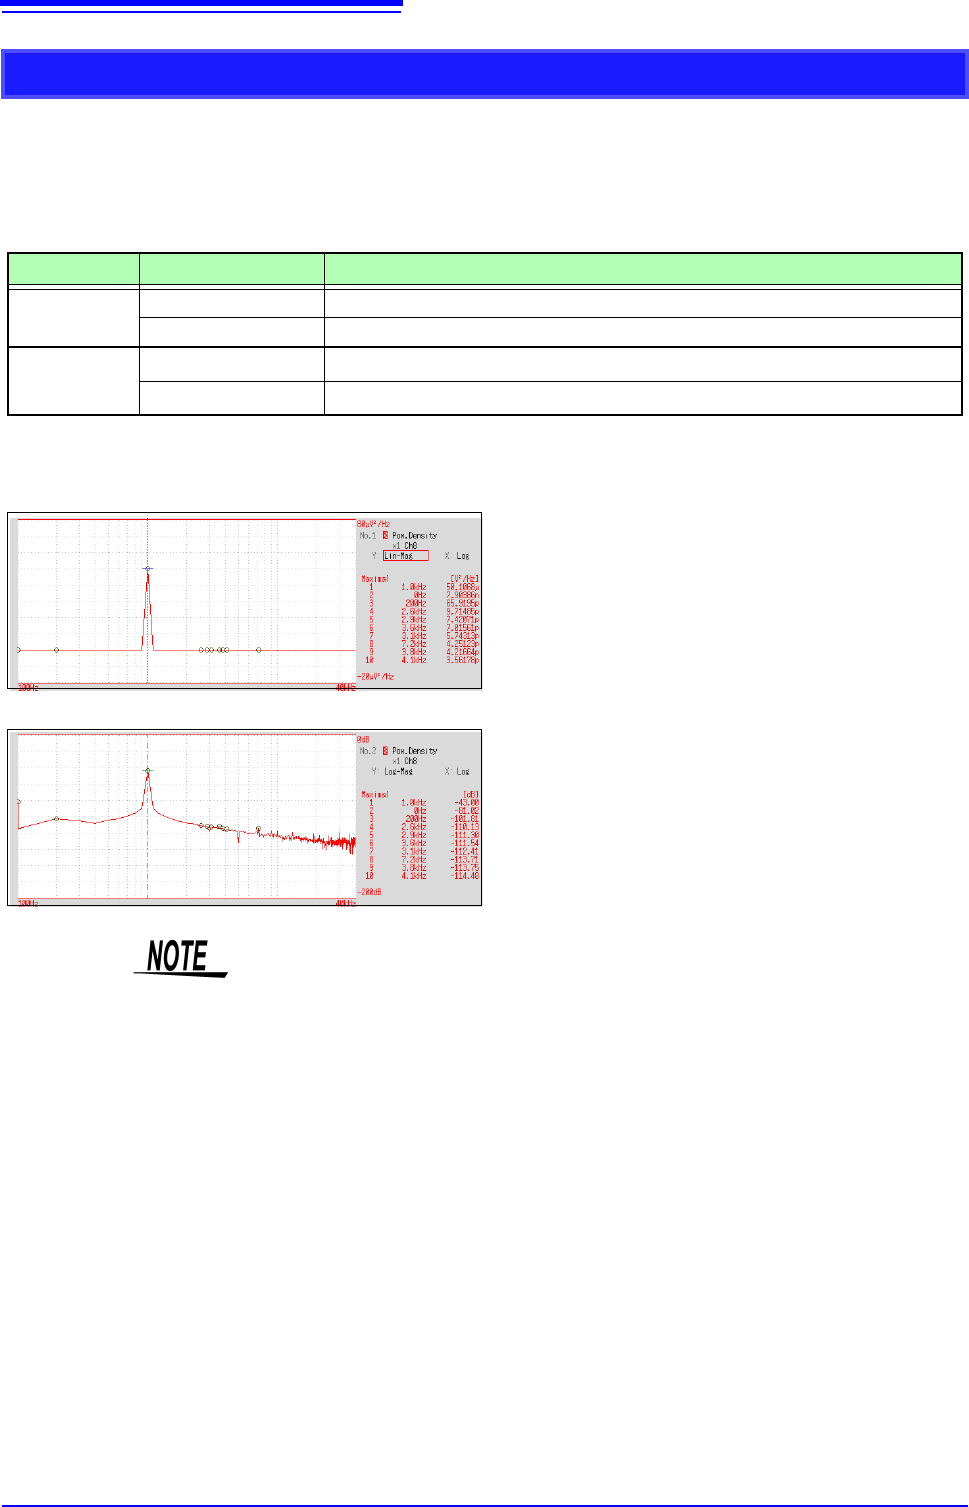
Waveform Example
Power Spectrum Density
Indicates the power spectrum density of the input signal with only the amplitude component
included. This is the power spectrum divided by the frequency resolution.
Main uses:
To acquire a power spectrum with 1-Hz resolution for highly irregular waveforms such as white noise
See: About the Functions"12.8.2 Analysis Mode Functions" (p.293)
Axis Display Type Description
X axis
Linear Frequency is displayed with equal spacing
Log Frequency display of logarithm interval
Y axis
Lin-Mag
Analysis values are displayed linearly.
Log-Mag(logarithm)
Analysis values are displayed as dB values. (0 dB reference value: 1eu
2
/Hz)*
* eu: engineering units that are currently set are the standard (e.g., when the unit settings is volts, 0 dB = 1 V
2
/Hz)
Normal display
X axis: Log
Y axis: Lin-Mag
Normal display
X axis: Log
Y axis: Log-Mag
Not available with external sampling enabled.