MR8740、MR8741_user_manual_eng_20191016H.pdf - 第80页
3.4 Setting Measurement Configuration 68 Description Selecting the time axis range Refer to the table below whe n setting the time axis range. For example, to m easure a 100 kHz waveform, the maximum display frequency se…
3.4 Setting Measurement Configuration
67
3
Chapter 3 Measurement Procedure
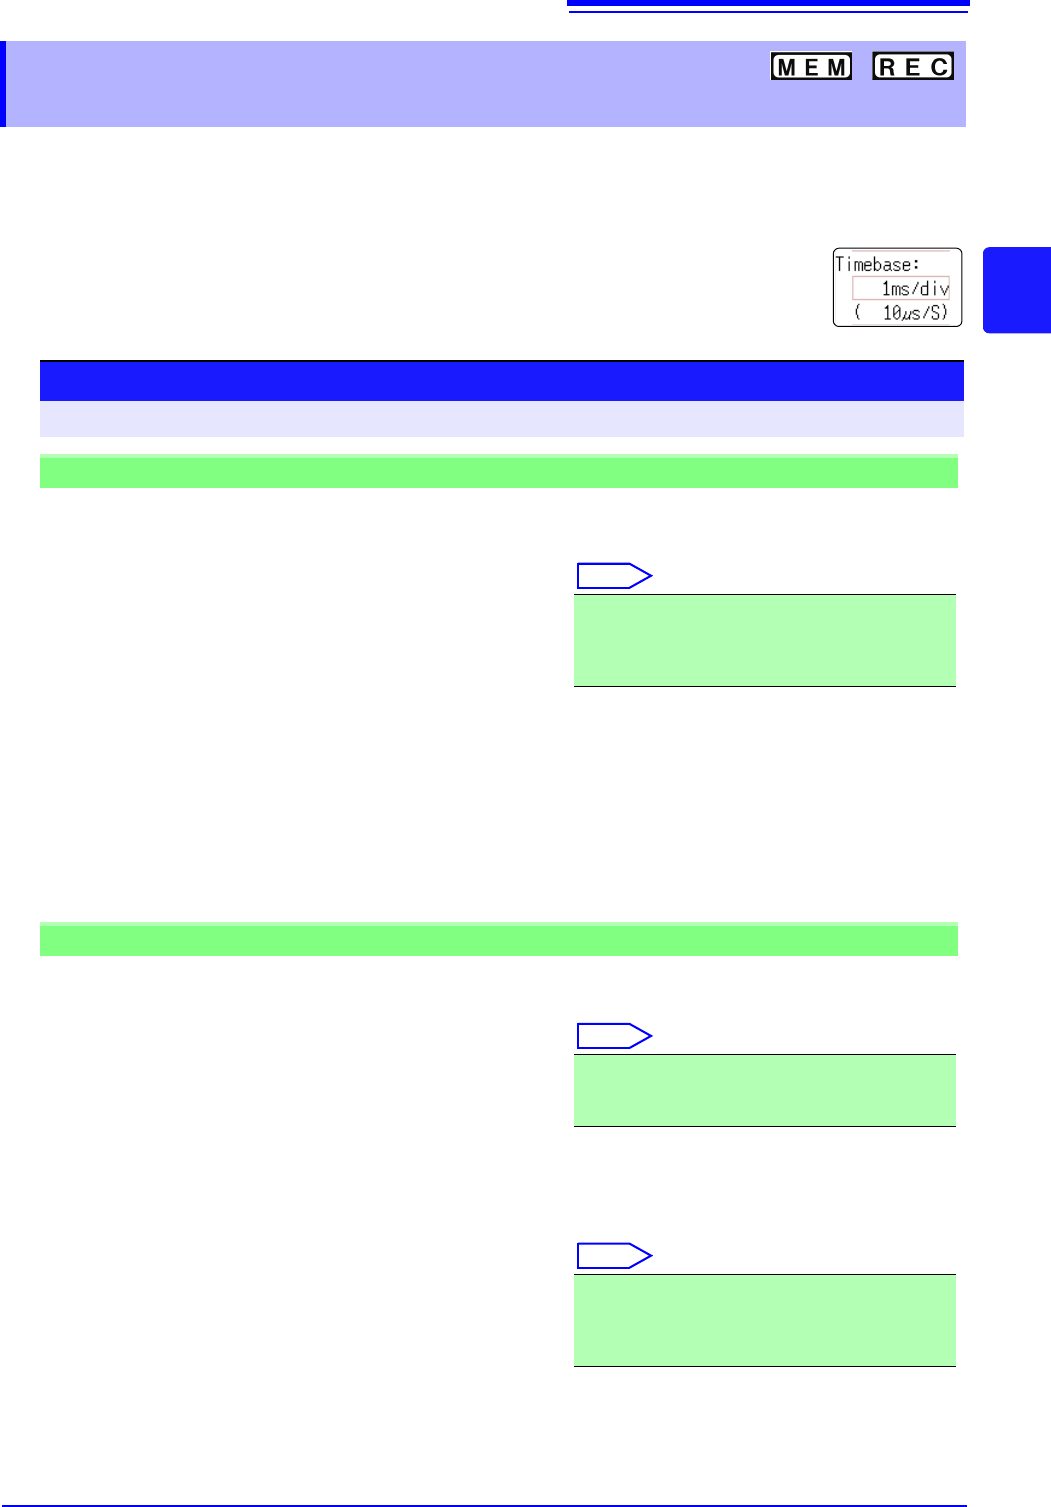
The timebase setting establishes the rate of input signal waveform acquisition, specified as time-
per-division on the horizontal axis (time/div).
The sampling setting specifies the interval from one sample to the next.
(The setting is shown in brackets under the time axis range for the Memory function (see illustration at
right). The indication changes with the time axis range.)
3.4.2 Time Axis Range and Sampling
Rate
Procedure
To open the screen: Right-click and select [DISP] Waveform screen
Memory Function case
1
Move the flashing cursor to the [Timebase] item,
and then left-click.
2
Set the time per division (timebase) on the hori-
zontal axis.
Select
To control sampling by an external signal, select [External]. (MR8741 only)
When external sampling is selected, the number of samples per division can be set in the range from 10
- 10000 S/div.
See: "16.2.3 External Sampling (SMPL)" (p.340)
5 (default setting), 10, 20, 50, 100, 200, 500 s/div
1, 2, 5, 10, 20, 50, 100, 200, 500 ms/div
1, 2, 5, 10, 30, 50 s/div, 1 min/div, 100 s/div
2, 5 min/div
Recorder Function case
1
Move the flashing cursor to the [Timebase] item.
2
Set the time per division (timebase) on the hori-
zontal axis.
Select
3
Move the flashing cursor to the [Sampling] item.
4
Set the sampling rate.
Select
The range of choices depends on the selected timebase.
The higher the sampling rate, the more detailed changes can be observed.
10 (default setting), 20, 50, 100, 200, 500 ms/div
1, 2, 5, 10, 30, 50 s/div, 1 min/div, 100 s/div
2, 5, 10, 30 min/div, 1 h/div
1 (default setting), 10, 100 s
1, 10, 100 ms
(Select a sampling rate less than 1/100 of the time
axis)
3.4 Setting Measurement Configuration
68
Description
Selecting the
time axis range
Refer to the table below when setting the time axis range.
For example, to measure a 100 kHz waveform, the maximum display frequency set-
ting range according to the table is 200 kHz - 800 kHz. If the maximum display fre-
quency is set to 400 kHz, setting the time axis range to 10 s/div is recommended.
Timebase Sampling Rate (Speed) Maximum display frequency
5 s/div
10 s/div
20 s/div
50 s/div
100 s/div
200 s/div
500 s/div
1 ms/div
2 ms/div
5 ms/div
10 ms/div
20 ms/div
50 ms/div
100 ms/div
200 ms/div
500 ms/div
1 s/div
2 s/div
5 s/div
10 s/div
30 s/div
50 s/div
1 min/div
100 s/div
2 min/div
5 min/div
50 ns (20 MS/s)
100 ns (10 MS/s)
200 ns (5 MS/s)
500 ns (2 MS/s)
1s (1 MS/s)
2 s (500 kS/s)
5 s (200 kS/s)
10 s (100 kS/s)
20 s (50 kS/s)
50 s (20 kS/s)
100 s (10 kS/s)
200 s (5 kS/s)
500 s (2 kS/s)
1 ms (1 kS/s)
2 ms (500 S/s)
5 ms (200 S/s)
10 ms (100 S/s)
20 ms (50 S/s)
50 ms (20 S/s)
100 ms (10 S/s)
300 ms (3.33 S/s)
500 ms (2 S/s)
600 ms (1.67 S/s)
1 s (1 S/s)
1.2 s (0.83 S/s)
3 s (0.33 S/s)
800 kHz
400 kHz
200 kHz
80 kHz
40 kHz
20 kHz
8 kHz
4 kHz
2 kHz
800 Hz
400 Hz
200 Hz
80 Hz
40 Hz
20 Hz
8 Hz
4 Hz
2 Hz
0.8 Hz
0.4 Hz
0.13 Hz
0.08 Hz
0.04 Hz
0.067 Hz
0.033 Hz
0.013 Hz
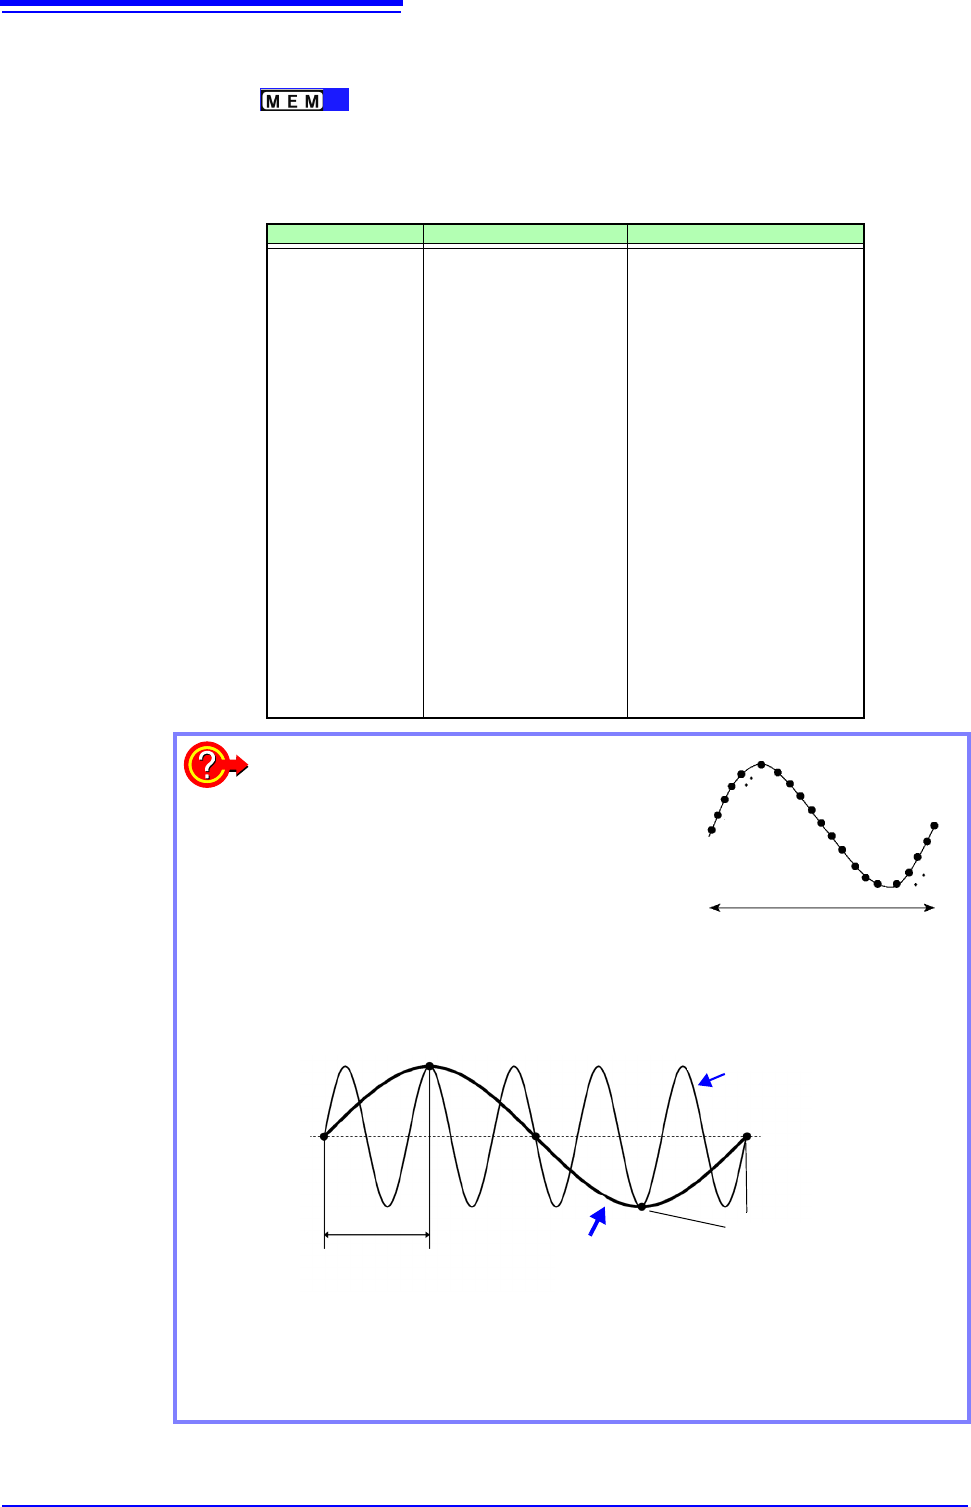
What is the maximum display frequency?
Displaying waveforms by their sampled values
with adequate resolution of characteristics such
as sine wave peaks requires a minimum of
about 25 samples per waveform period.
Maximum display frequency is determined by
the timebase.
What is aliasing (recording of non-existent waveforms)?
If the signal to be measured changes too fast relative to the sampling rate,
beginning at a certain frequency, non-existent slow signal fluctuations are
recorded. This phenomena is aliasing.
With the Memory function, the sampling rate can be significantly affected by the
timebase setting, so care is necessary to avoid aliasing when selecting the
timebase. Because the timebase determines the maximum display frequency,
the fastest possible timebase setting should be used.
One Signal Period
1
2
3
23
24
25
Sampling Rate
Measured Waveform
Aliasing occurs when the sampling period is longer
than half of the input signal period.
Actual Input Signal
Sampling Points
3.4 Setting Measurement Configuration
69
3
Chapter 3 Measurement Procedure
The sampling rate is automatically set to 1/100 of the selected time axis range.
If MR8990 Digital Voltmeter Unit is installed, the sampling rate for the chan-
nels of that unit is set to 1/50.
Example: When 8966 is installed on unit 1 (channels 1 and 2) and MR8990 on
unit 2 (channels 3 and 4), and the time axis is set to 1 s/div
Sampling rate of unit 1 (8966): 10 ms
Sampling rate of unit 2 (MR8990): 20 ms
_______________________________________________________________
• The timebase and sampling rate can be set independently. The sampling rate
is selected depending on the timebase setting.
• When the following timebase values are selected, displayed waveforms are
compressed in the horizontal (time axis) direction as shown.
20 ms/div x1/2
10 ms/div x1/5
_______________________________________________________________
Common
To minimize noise during measurement
If the sampling rate is set too fast, when the input waveform ampli-
tude is small, the difference between maximum and minimum values
may become quite large as a result of sudden impulses such as
noise. To prevent such phenomena, select a slower sampling rate or
enable the module's lowpass filter (p.76).
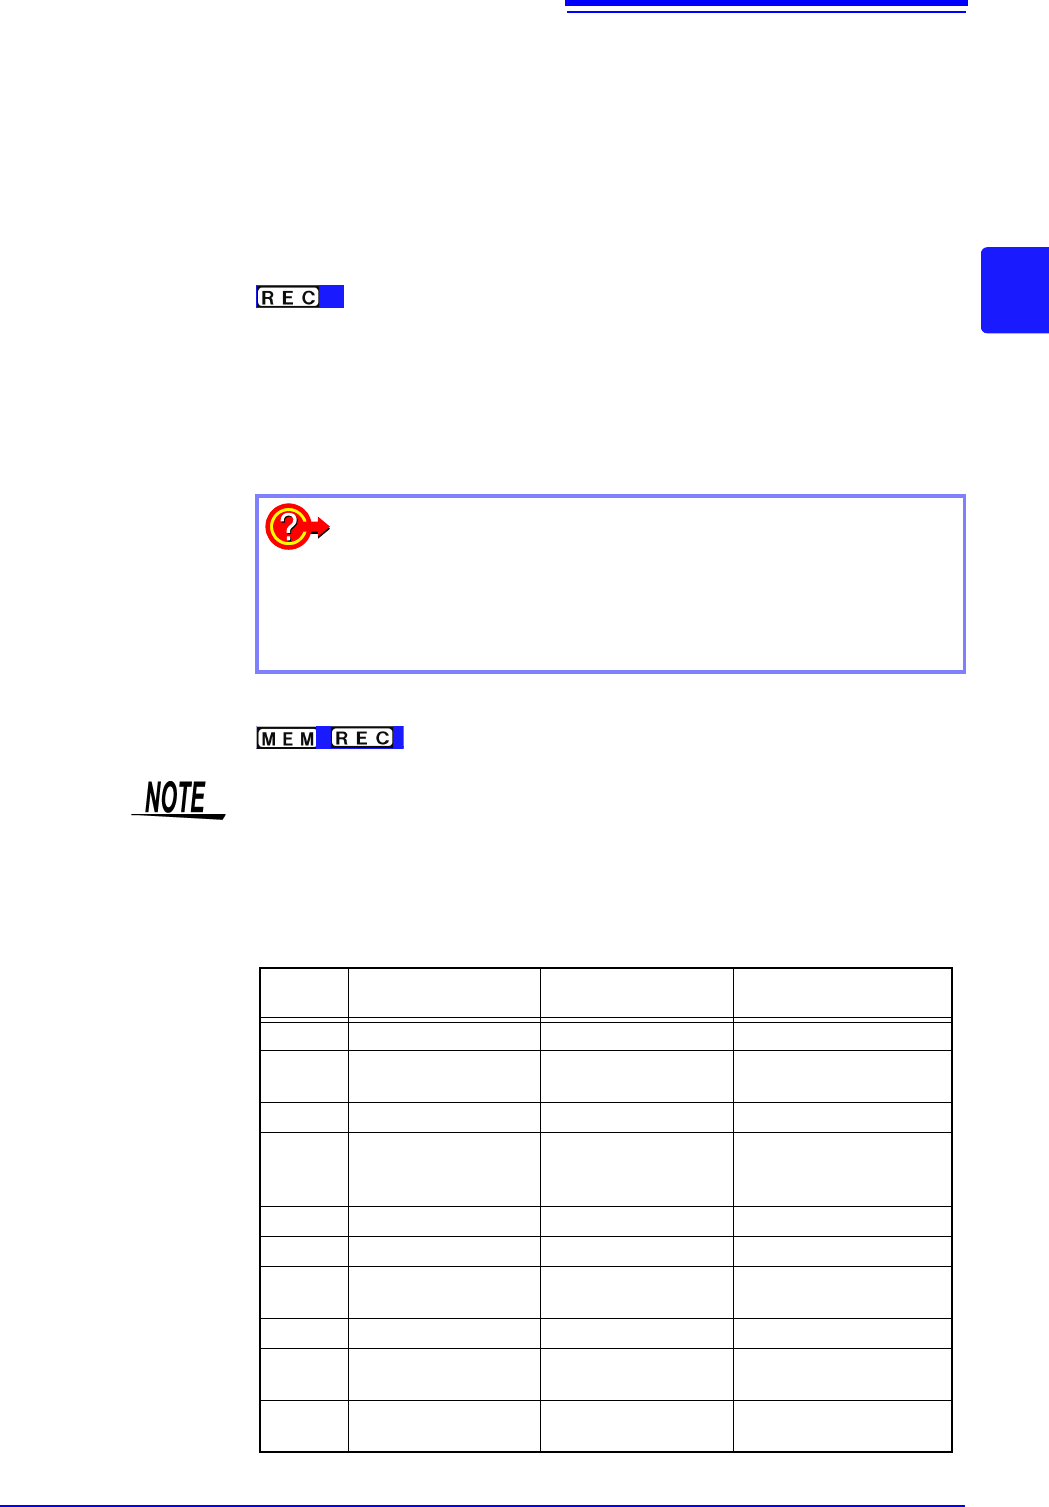
The data refresh rate is not allowed to exceed the maximum sampling rate of the
module.
During the period when data are not updated, the same data are measured,
resulting in a stair-shaped waveform. Even when the same signal is input simul-
taneously by two units, the data may differ due to differences in sampling rate,
frequency bandwidth, and frequency response.
Data refresh rate for various units
Module Max. timebase
Max. sampling rate or
data refresh rate
Reference information
8966 5 s/div 50 ns (20 MS/s) -
8967
Dependent on data re-
fresh setting
Dependent on data re-
fresh setting
See: "7.9.3"(p.163)
8968 100 s/div 1 s (1 MS/s) -
8969,
U8969,
U8979
500 s/div 5 s (200 ks/s) -
8970 Dependent on setting Dependent on setting See: "7.9.5"(p.166)
8971 100 s/div 1 s (1 MS/s) See: "7.9.6"(p.169)
8972
Dependent on re-
sponse setting
Dependent on re-
sponse setting
See: "7.9.7"(p.170)
8973 5 s/div 50 ns (20 MS/s) -
MR8990
Dependent on NPLC
setting
Dependent on NPLC
setting
-
U8974
Dependent on NPLC
setting
Depends on response
setting
See: "7.9.9"(p.173)