MR8740、MR8741_user_manual_eng_20191016H.pdf - 第271页
12.3 Setting FFT Analysis Conditio ns 259 11 Chapter 12 FFT Function 12 By specifying a setting factor (rate ) to be applied to th e input signal, the display of data exceeding the result- ing threshold can be empha size…
12.3 Setting FFT Analysis Conditions
258
Trigger Modes and Averaging
If the trigger mode is [Single] or the calculation setting is [Once]
Measurements continue until the specified number of averaging points is acquired.
If the trigger mode is [Continue] or the calculation setting is [Repeat]
Measurement continues after the specified averaging count has been acquired.
When the specified averaging count is exceeded, averaging is repeated and measurement continues until
[STOP] is
clicked.
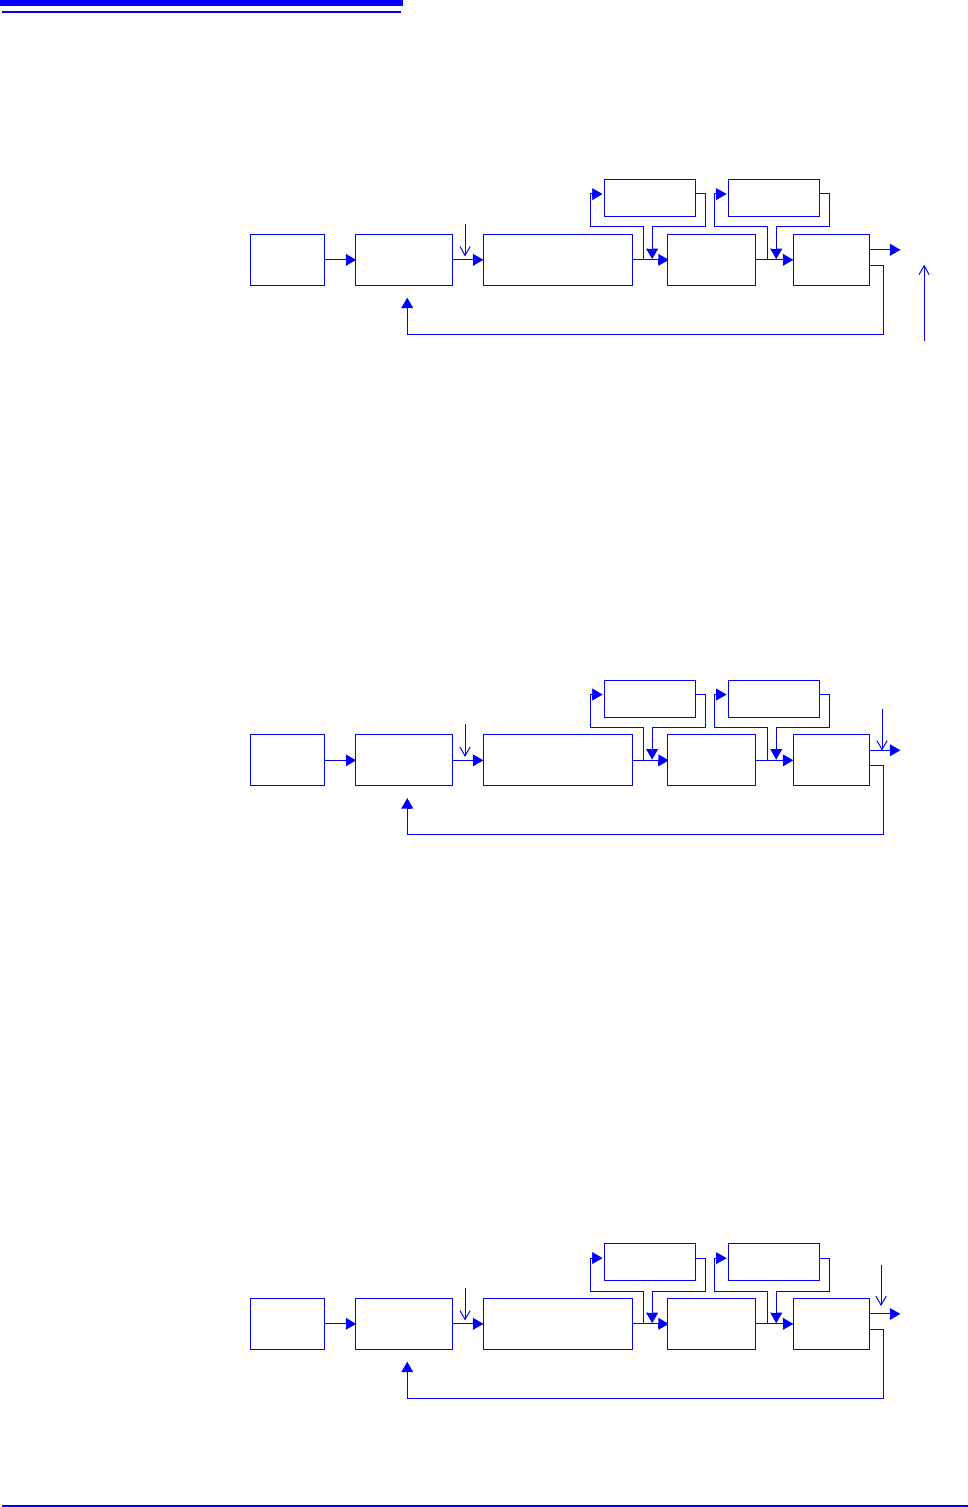
When the trigger mode is [Auto]
•For time-domain waveforms:
Data is acquired when [START] is clicked, even if trigger criteria are not met after a certain interval. So
if averaging is applied to an asynchronous signal, the resulting data is meaningless.
•For spectrum values:
When [START] is clicked, measurement starts. Even if the trigger criteria are not met, the specified
amount of data is acquired, and after FFT analysis, the results are averaged.
When the specified averaging count is exceeded, averaging is repeated and measurement continues
until [STOP] is clicked.
When the acquired count < the specified count *
1
When the acquired
count = the speci-
fied count
Start Measurement
[START]
End *
2
Trigger
criteria met
Input
Signal
Awaiting
Trigger
Waveform acquisi-
tion (specified no.
of points)
Averaging
Display*
3
FFT
analysis
(Spectrum averaging)
(Waveform averaging)
*1. Awaiting trigger continues until the specified count is reached.
*2. Measurement stops automatically when the specified count is
reached. If measurement was interrupted by clicking [STOP], the
averaging result up to that point is displayed.
*3 If [Reference] is [New Data] and the automatic saving setting is
ON, data is saved when the specified number of times is
reached.
FFT
analysis
Repeats until [STOP] is clicked
Start Measurement
[START]
End*
1
Trigger
criteria met
Input
Signal
Awaiting
Trigger
Waveform acquisi-
tion (specified no.
of points)
Averaging
Display*
2
FFT
analysis
(Spectrum averaging)
(Waveform averaging)
*1 When stopped before the specified count, the average up to that point is displayed.
*2 If [Reference] is
[New Data] and the automatic saving setting is On, data is saved
when the specified number of times is reached.
FFT
analysis
[STOP]
Repeats until [STOP] is clicked
Start Measurement
[START]
End*
After a certain interval,
acquisition starts even if
trigger criteria are not met
Input
Signal
Awaiting
Trigger
Waveform acquisi-
tion (specified no.
of points)
Averaging
Display
FFT
analysis
(Spectrum averaging)
(Waveform averaging)
* When stopped before the specified count, the average up to that point is clicked.
FFT
analysis
[STOP]
12.3 Setting FFT Analysis Conditions
259
11
Chapter 12 FFT Function
12
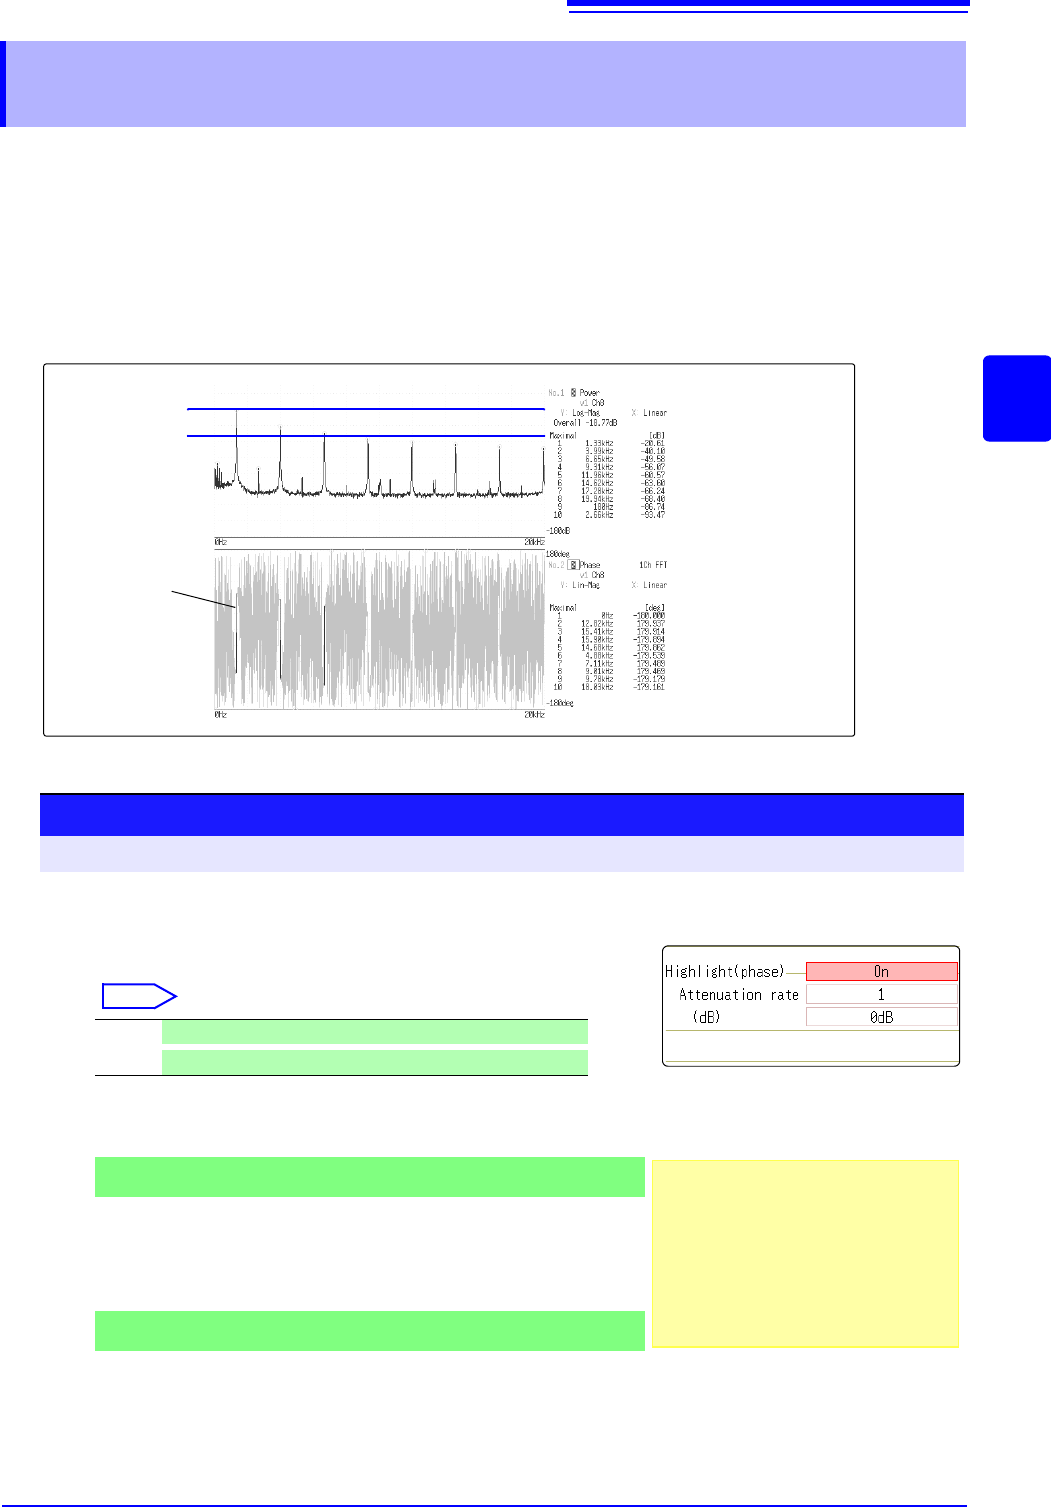
By specifying a setting factor (rate) to be applied to the input signal, the display of data exceeding the result-
ing threshold can be emphasized. This feature is useful for viewing waveforms that may otherwise be
obscured by noise.
The reliability of phase spectrum values is poor when discrete Fourier transform values are extremely small.
For example, in the case of a pure sine wave, almost all phase values at frequencies other than the input fre-
quency result from calculation errors. By treating the maximum value of the power (or cross-power) spectrum
of the input signal,
P
max
, as a reference value, data that exceeds that value multiplied by rate R can be dis-
played with emphasis.
12.3.8 Emphasizing Analysis Results (phase spectra
only)
Power Spectrum
Phase Spectrum
Emphasis
Display
10logP
max
[dB]
10logRP
max
[dB]
Attenuation Rate and Value
Attenuation value: A [dB]
Attenuation rate: R
-A = 10log
10
R
1 x 10
-6
R 1
0
A 60
1
Enable the highlighting function.
Move the flashing cursor to the [Highlight(phase)] item.
Select
2
Set the attenuation rate or attenuation value.
To set an attenuation rate
Move the flashing cursor to the [Attenuation rate] item.
Enter the attenuation rate.
See: "7.1.3 Alphanumeric Input" (p.141)
To set an attenuation value [dB]
Move the flashing cursor to the [(db)] item.
Enter the attenuation value.
See: "7.1.3 Alphanumeric Input" (p.141)
Off Emphasis display disabled. (default setting)
On
Emphasis display enabled.
Procedure
To open the screen: Right-click and select [STATUS] [Status] sheet
1
2
3
12.3 Setting FFT Analysis Conditions
260
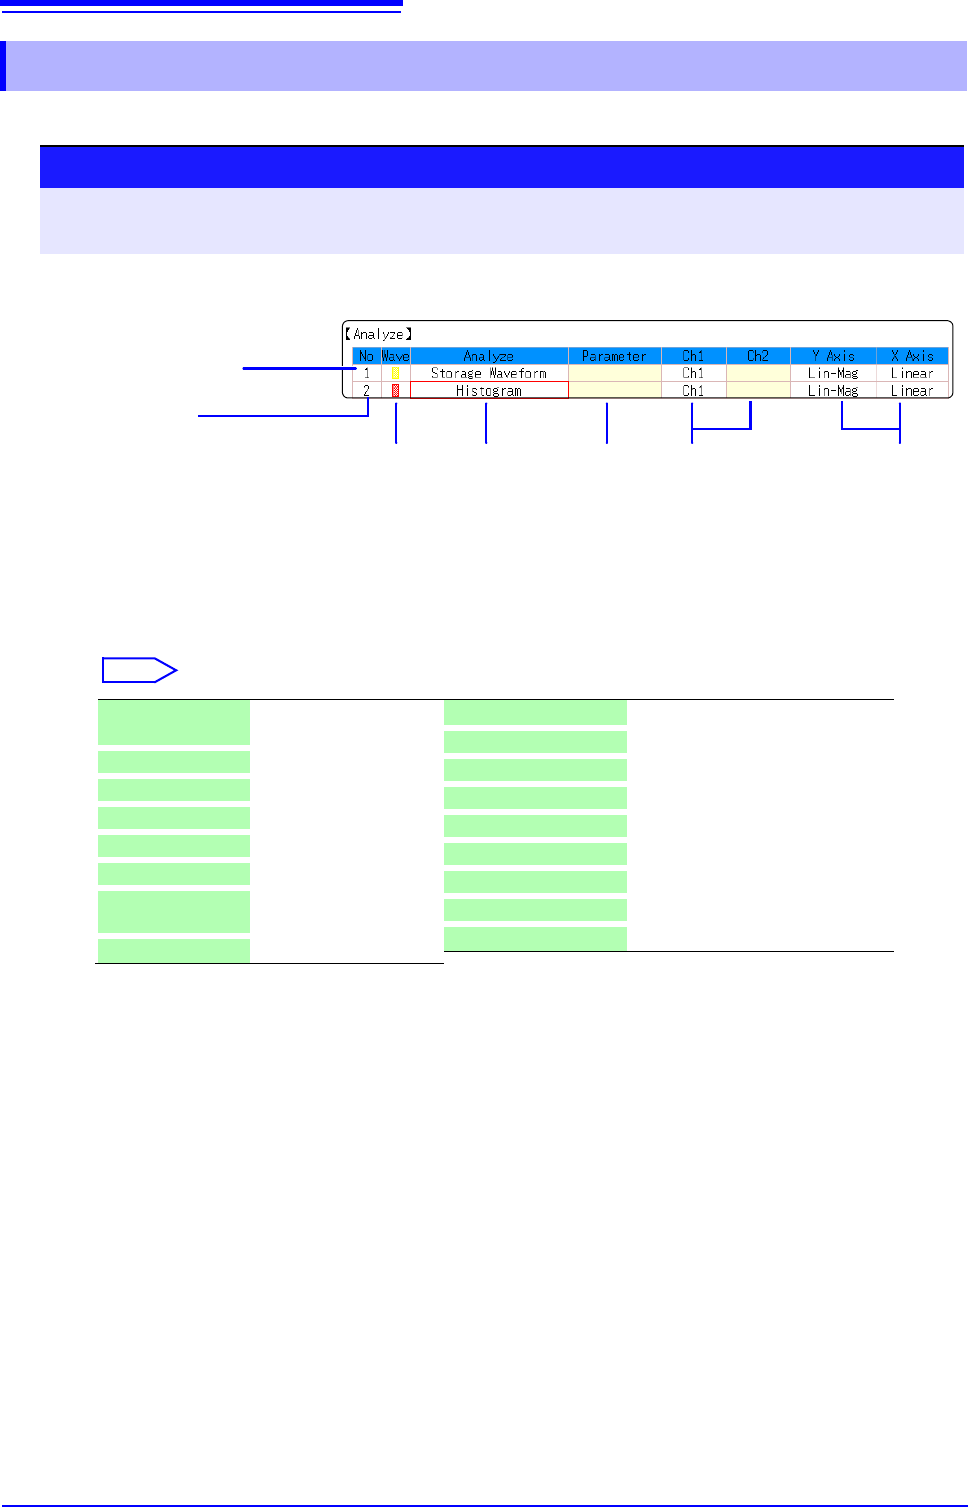
Select the type of FFT analysis, channel(s), waveform display color and x and y axes.
12.3.9 Analysis Mode Settings
1
Select the FFT analysis mode.
Move the flashing cursor to the [Analyze] column of the Analysis No.
to se
t.
Select
(When [List] is selected, a list of calculation types appears.)
2
Select whether to display the waveform, and its color.
Move the flashing cursor to the [Wave] column.
Select whether the waveform is to be displayed (On) or not, and its
color if displayed.
Analysis No.
Settings can be made from the
dialogs, or copied from another
Analysis No. (p.160)
Analysis
Type
1
2
Analysis Setting
Contents
Channel for
Analysis
34 5
Display
Color
X/Y Axes
Display
Parameter
Off No analysis.
(default setting)
Storage Waveform (p.275)
Histgram (p.275)
Linear Spectrum (p.276)
RMS Spectrum (p.277)
Powre Spectrum (p.279)
Powre Spectrum
density*
(p.280)
LPC (density)* (p.281)
Transfer Function (p.282)
Cross Power Spectrum (p.283)
Impulse Response (p.284)
Coherance Function (p.285)
Phase Spectrum (p.286)
Auto-Correlation (p.287)
Cross-correlation (p.288)
1/1 Octave* (p.288)
1/3 Octave* (p.288)
*Not available with external sampling enabled.
See: "12.8.2 Analysis Mode Functions" (p.293)
Procedure
To open the screen: Right-click and select [STATUS] [Status] sheet
See: To set from the Waveform screen (p.265)