IPC-TM-650 EN 2022 试验方法.pdf - 第21页
c. Standard Practice for Conducting an Interlaboratory Study to Determine the Precision of a Test Method, E691-99, ASTM, Philadelphia, PA (www.astm.org). d. Concepts for R&R Studies, Larry B. Barrentine, (ISBN 0-8738…

test groups. Prepare more than the material required to
ensure an adequate amount is available for the study in case
of lost or damaged specimens, errors, test set-up, etc.
Carefully package and label the material. Assign serial num-
bers, if possible. Identify the version of the test procedure.
Specify care and handling procedures. Provide a data sheet,
and describe any documentation required. Require a test log,
and insist that observations of any unusual events be
recorded.
5.2
Conducting the Evaluation
Ensure
the samples are
inspected on receipt. Send replacement material if damaged
or tests are performed improperly.
Inspect the data sheets when returned. Review the test logs
for unusual events. Review the results. Question unusual dis-
positions or comments. Incorrect dispositions and typos must
be fixed prior to analysis.
5.3
Analyzing the Data
Analysis may be performed on the
data sheet or on the Excel spreadsheet (see 6.2).
The basic techniques involve beginning with a set of parts or
materials for which the classification has been previously
determined. Several inspectors or testers then examine and
classify the parts and the results are compared with the
known standard classification.
The effectiveness of the test is the number of correct determi-
nations divided by the total number of classification opportu-
nities (number of parts times the number of inspectors).
E =
Number
of correct dispositions
Number
of parts x Number of testers
(1)
The
probability of a false reject and the probability of a false
accept can be defined as follows:
P(FR)=
Number of dispositions where good parts were rejected
Number
of good parts x Number of testers
(2)
P(FA)=
Number
of dispositions where bad parts were accepted
Number of bad parts x Number of testers
(3)
5.4
Preparing Analysis Conclusions
Goals
for measure-
ment precision should be established before the study begins.
The goals should be established using knowledge of the
anticipated levels of product variability (or process capability),
specifications, customer needs and the possible impact of
dispositioning test samples improperly. As a rule of thumb, the
guidelines shown in Table 1 have been extensively applied.
If the test effectiveness is inadequate, then steps should be
taken to diagnose and improve the causes of the deficiency.
The probabilities of false acceptance and false rejection
should help in this diagnosis. Marginal tests should also be
improved.
An acceptable test effectiveness rating (E) indicates that the
test method dispositions the products with reasonable cor-
rectness.
The results of this evaluation should be compared to the test
efficiency goals for this inspection. The rules of thumb noted
above have been found to be useful. These goals could be
amended, depending on the criticality of the inspection, and
the impact of incorrect disposition.
6 Notes
6.1 Methods for Analyzing Repeatability and Reproduc-
ibility
This
test method covers situations where the mea-
surements result in binary data, such as go and no-go, or
pass and fail tests. The precision of the test is determined by
calculating the consistency and correctness of the sample
dispositions.
Measurements that result in variables data can be analyzed
using IPC Test Method IPC-TM-1.9.
In some cases, the measurement cannot be repeated more
than once on the same sample. This is common where the
sample is consumed during the test, such as chemical analy-
sis, or changed during testing, such as solderability evalua-
tions. In these cases, the analysis using a modified average
and range method is possible. This method is under develop-
ment.
6.2
References
a.
ISO 5725-1 Accuracy (trueness and precision) of measure-
ment methods and results (parts 1 to 6), 1998(E), Interna-
tional Organization for Standardization, Geneva, Switzer-
land (www.iso.org).
b. Measurement Systems Analysis, 2nd edition, June 1998,
Automotive Industry Action Group (AIAG), 26200 Lahser
Road, Southfield, MI 48034 (www.aiag.org).
T
able 1 Recommended evaluation criteria
Metric
Acceptable Marginal Inadequate
E
>0.9 0.8 to 0.9 <0.8
P(FR) <0.05 0.05 to 0.10 >0.10
P(FA) <0.02 0.02 to 0.05 >0.05
IPC-TM-650
Number
1.8
Subject
Measurement
Precision Estimation for Binary Data
Date
01/03
Revision
A
P
age2of6

c. Standard Practice for Conducting an Interlaboratory Study
to Determine the Precision of a Test Method, E691-99,
ASTM, Philadelphia, PA (www.astm.org).
d. Concepts for R&R Studies, Larry B. Barrentine, (ISBN
0-87389-108-2), ASQC Press, Milwaukee, WI ((www.quali-
typress.asq.org).
e. Basic Statistics, 4th Edition, Mark J. Kiemele, Stephen R.
Schmidt, Ronald Berdine, Air Academy Press, 1997, ISBN
1-880156-06-7, pages 9-71 to 9-77
f. ‘‘Is 100% Test 100% Effective,’’ W. Russell, 1998 IPC
EXPO, San Jose, CA (gives methods for calculating the
likely outcomes on product test for differing levels of mea-
surement precision.)
6.3
Software
Measurement precision studies are greatly
facilitated by use of software to perform the calculations.
Below are just a few of the many software packages which
can be used for this purpose. Reference (a) is an Excel
spreadsheet written to perform the calculations in this proce-
dure.
a. Measurement Precision Calculator For Binary Data, Excel
spreadsheet, available at http://www.ipc.org/html/
testmethods.htm, free of charge.
b. Statgraphics Plus, Manugistics Corp, 2115 East Jefferson
Street, Rockville, MD, 20852-4999 (www.statgraphic-
s.com).
c. SPC XL, Air Academy Press, 1155 Kelly Johnson Blvd,
Colorado Springs, CO 80920 (www.airacad.com).
d. Minitab, Minitab. Inc., 3081 Enterprise Dr, State College,
PA 16801 (www.minitab.com).
e. Interlaboratory Data Analysis Software for E691, ASTM,
100 Barr Harbor Dr, West Conshohocken, PA 19428
(www.astm.org).
IPC-TM-650
Number
1.8
Subject
Measurement
Precision Estimation for Binary Data
Date
01/03
Revision
A
P
age3of6
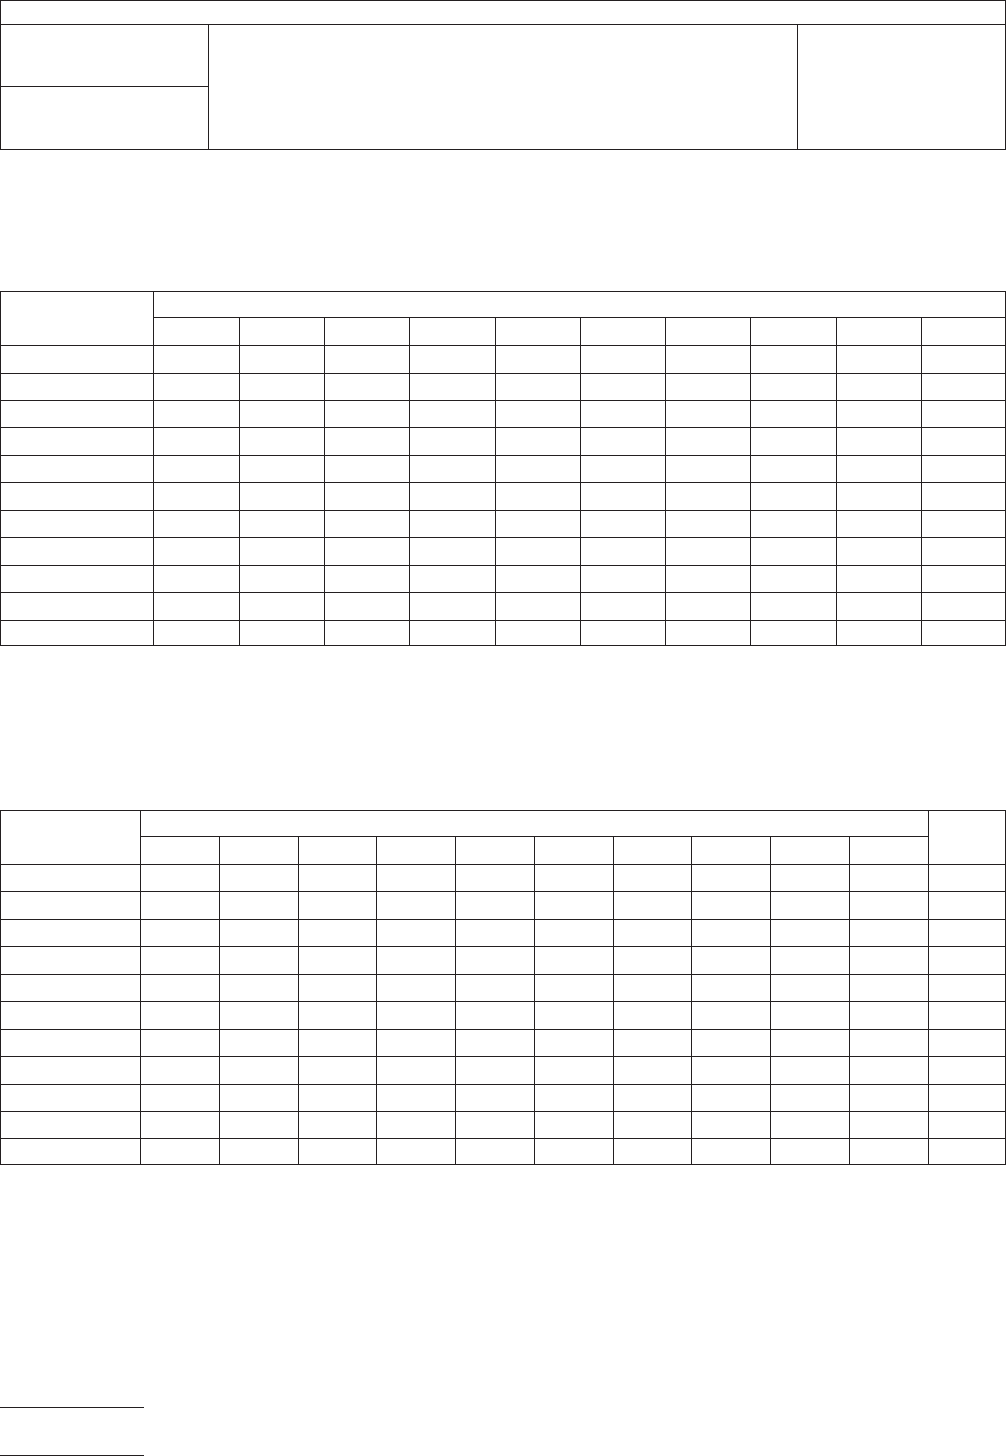
Measurement
Precision Study – Binary Data
Calculations
Table 1: Data Entry Form
Enter test results into the table below.
T
ester
Samples
12345678910
True
Standard
1
2
3
4
5
6
7
8
9
10
Table 2: Samples Dispositioned Correctly
Score a ‘‘1’’ where disposition in Table 1 above matched the true standard.
Score a ‘‘0’’ where disposition did not match the true standard.
Note these scores for each of the testers in the table below.
T
ester
Samples
12345678910Total
True
Standard
1
2
3
4
5
6
7
8
9
10
IPC-TM-650
Number
1.8
Subject
Measurement
Precision Estimation for Binary Data
Date
01/03
Revision
A
P
age4of6