IPC-TM-650 EN 2022 试验方法.pdf - 第768页
T able 5-1 260 °C Nominal Reflow Profile Specifications (Default)* V alue Time (Seconds) T emperature (°C) Description t1 210 ± 15 – Target preheat time t2 270 ± 10 – Target peak reflow time t3 330 ± 15 – Target cool-down s…

4.2 Convection Reflow Oven or Simulator
4.2.1
The system used to simulate the thermodynamic
effects of assembly shall be convection reflow.
4.2.1.1 The system shall have adequate environmental
controls to maintain the tolerance range and limits in accor-
dance with the reflow profile depicted in either Figure 5-1,
Figure 5-2 or Figure 5-3.
4.2.1.2 The system should accommodate verifiable calibra-
tion compliance and reflow profile generation. See note 6.1 for
additional considerations.
4.2.1.3 The test specimen shall be handled and stored in a
controlled environment to minimize moisture ingression. See
IPC-1601 for details on the proper handling and storage of
test specimens.
4.2.2 Deviations to the equipment requirements and
acceptability of the alternative methods shall be AABUS.
4.3 Microscope
4.3.1
The magnification used for defect recognition must be
in agreement with the inspection requirements/capabilities
defined in the applicable performance specification (e.g., IPC-
6012, IPC-6013, IPC-6018, etc.) and IPC-A-600.
4.4 Resistance Measurements of IPC-2221 Appendix A,
D Coupons
4.4.1
When specified by performance specification or pro-
curement documentation, resistance measurements of the
IPC-2221B Appendix A, D coupons shall be required.
4.4.2 The resistance measurement shall have enough pre-
cision to clearly determine the resistance percent change as
required by the user for the resistance level of each sample’s
nets.
4.4.3 The total system uncertainty from resistance, tem-
perature and time/cycle variations shall be less than 10% of
the failure criteria required by the user. For example, if the
required failure criteria is 5% then the total system uncertainty
shall be no greater than 0.50%.
4.4.4 The resistance data shall consist of at least 1 reading
per sample net every second during the entire reflow cycle.
5 Procedure
5.1 Conditioning
5.1.1 The test specimen shall be conditioned by drying in an
oven to remove moisture for a minimum of six (6) hours at 105 to
125 °C [221 to 257 °F].
5.1.2
Test specimens that are thicker or more complex may
require longer baking times to achieve acceptable moisture
levels. Record the bake times and temperature if different than
those stated in 5.1.1. See IPC-1601 for additional guidance
on baking to achieve acceptable moisture levels. See note
6.2.
5.1.3 Deviations to the conditioning requirements in 5.1.1
such as when used for acceptance criteria and/or any
changes to the time and temperature shall be AABUS. See
6.3.
5.2 Reflow Profile
5.2.1
Reflow the test specimen in accordance with Table
5-1 (default), Table 5-2 (low temperature profile) or Table 5-3.
5.2.2 The reflow profile shall be in accordance with either
Figure 5-1, Figure 5-2 or Figure 5-3. Figure 5-1 represents the
default reflow profile. Figure 5-2 represents the low tempera-
ture profile. Figure 5-3 represents a 245 °C reflow profile. The
times to t1, t2 and t3 may vary based on the mass of the
sample test specimen. To avoid over stressing of samples,
times should be shortened for low mass samples. Times
should be extended for high mass samples, such that the
zone (air) temperature shall not be more than 25 °C above
the target surface temperature at any point in the cycle.
The attachment of thermocouples to the sample test speci-
men shall be such that the reflow profile is calibrated to the
surface temperature of the test specimen.
5.2.3 The test specimen shall be subjected to a minimum
of six (6) reflow cycles.
5.2.4 The cool down rate shall be in accordance with Table
5-1, Table 5-2 or Table 5-3, based on the reflow profile
selected in 5.2.1. The cool down is complete when the test
specimen reaches 45 °C. The test specimen shall achieve a
thermal equilibrium of 45 °C or less prior to starting the next
reflow cycle. If the time it takes to achieve thermal equilibrium
cannot be determined, then a five (5) minute dwell between
reflow cycles shall be required.
5.2.5 Deviations to the reflow profile or number of cycles
shall be AABUS.
IPC-TM-650
Number
2.6.27
Subject
Thermal Stress, Convection Reflow Assembly Simulation
Date
2/2020
Revision
B
Page2of10

Table 5-1 260 °C Nominal Reflow Profile Specifications (Default)*
Value Time (Seconds) Temperature (°C) Description
t1 210 ± 15 – Target preheat time
t2 270 ± 10 – Target peak reflow time
t3 330 ± 15 – Target cool-down start time
t3 - t1 120 ± 30 – Target time above T1
T1 – 230 Maximum preheat temperature
T2 – 260 ± 5 Target reflow temperature
Point Time (Seconds) Temperature (°C) Description
A030
Upper specification limit values
B 100 230
C 195 230
D 255 265
E 285 265
F 345 230
G 550 30
H3030
Lower specification limit values
I 157 93
J 225 230
K 260 255
L 280 255
M 315 230
N 383 30
Segment Slope (°C / second) Description
A-B & I-J 2.0 Maximum preheat rate
H-I 0.5 Minimum preheat rate
F-G -1.0 Minimum cool-down rate
M-N -3.0 Maximum cool-down rate
IPC-TM-650
Number
2.6.27
Subject
Thermal Stress, Convection Reflow Assembly Simulation
Date
2/2020
Revision
B
Page3of10
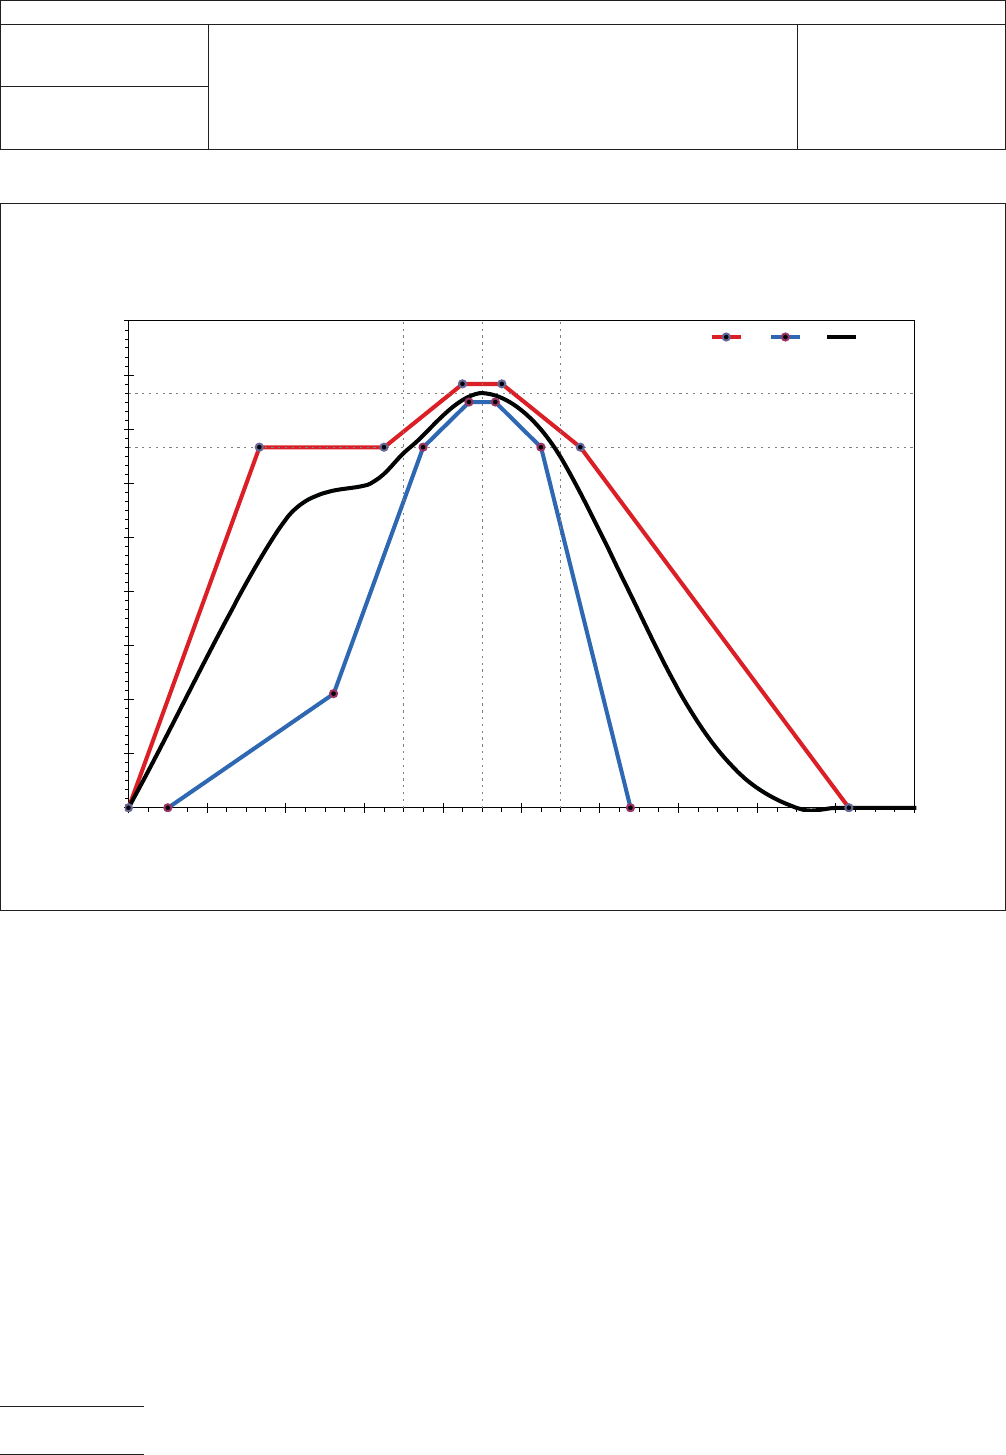
IPC-2627-5-1
Figure 5-1 260 °C Nominal Reflow Profile Chart (Default)*
260 °C Reflow Profile Specifications
t1 t2 t3
A
BC
DE
F
G
H
I
J
KL
M
N
T1
T2
30
60
90
120
150
180
210
240
270
300
0 60 120 180 240 300 360 420 480 540 600
Time (Seconds)
Temperature (°C)
USL LSL Example
IPC-TM-650
Number
2.6.27
Subject
Thermal Stress, Convection Reflow Assembly Simulation
Date
2/2020
Revision
B
Page4of10