IPC-TM-650 EN 2022 试验方法.pdf - 第30页
Measurement Systems Analysis For Binary Data Test Effectiveness Calculator Version 1.0, August 2002 Introduction Welcome to the Measurement Precision Calculator. This utility is intended to perform the calculations for M…
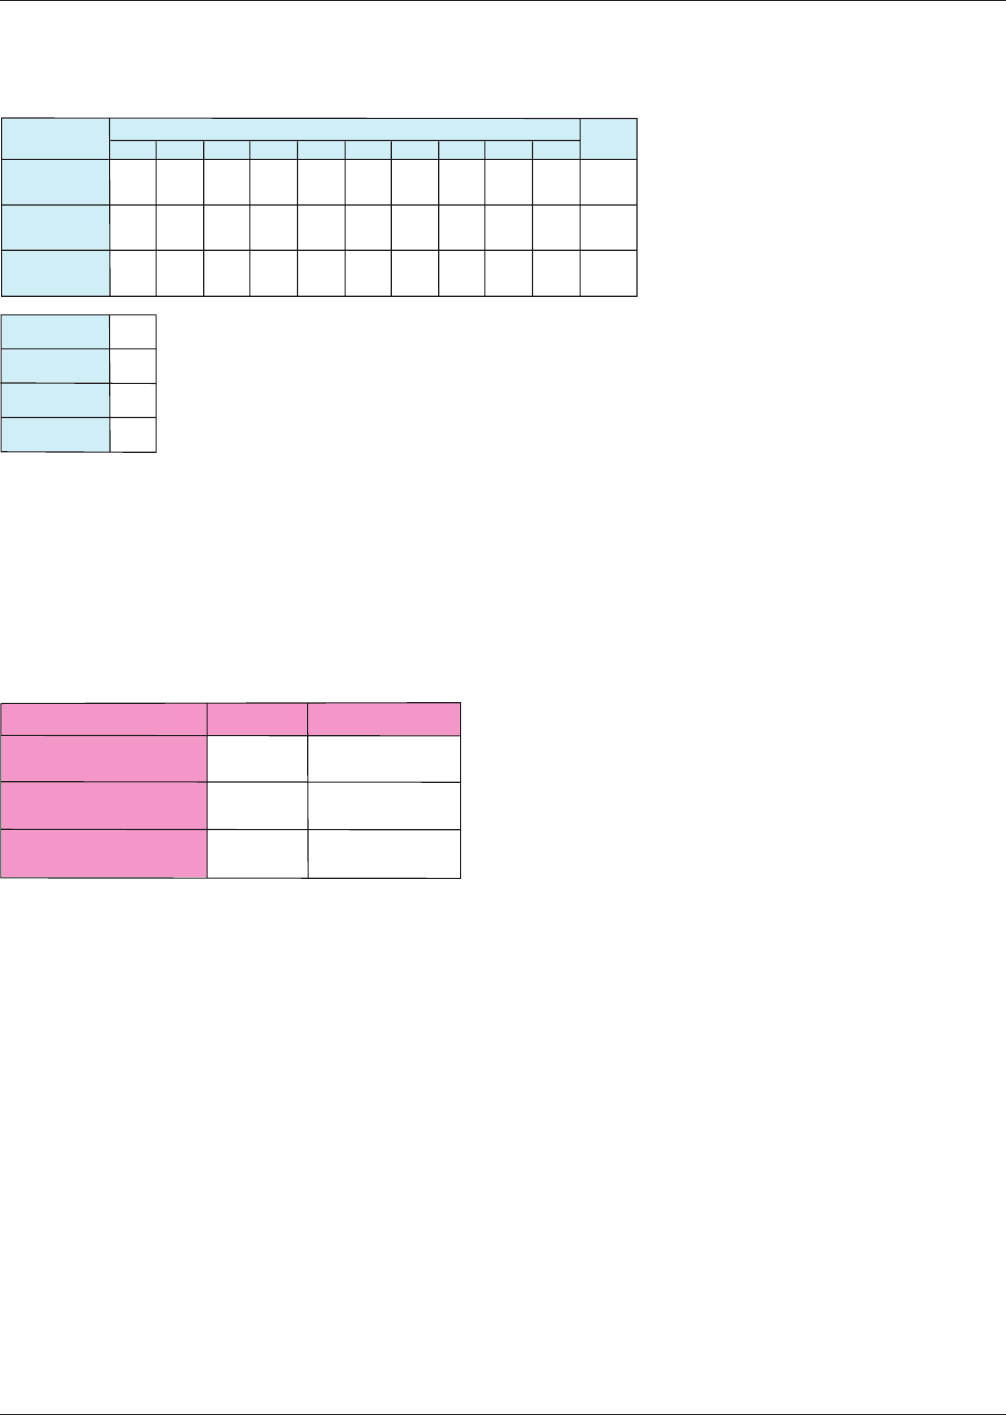
Scorecard
The
final results are summarized and totaled on the scorecard.
The scorecard shows the total number of dispositions in each category for each tester. All testers are summed on the right
side on the table.
Below the scorecard is another table summarizing the number of tests performed, the number of good parts, the number of
bad parts, and the number of testers.
T
est Effectiveness
The
final section shows the test effectiveness calculation.
The first metric is the overall test effectiveness. This is a percentage, showing what portion of the dispositions were per-
formed correctly. A rule of thumb is that in a good test, the dispositions must be performed correctly at least 90% of the
time. Any test effectiveness less than 80% would be unacceptable. In this case the result is in the middle zone, where
improvement is recommended.
The next metric is the percent of good parts falsely rejected. In good tests, the false reject rate would be less than 5%. Any
test with a false reject rate greater than 10% needs improvement, which is the case here.
The final metric is the probability of passing bad parts. In a good test the false accept rate should be less than 2%. Any false
accept rate greater than 5% should be improved. That is the case here.
These results should be compared to the goals for the effectiveness of this inspection or test. These goals should be based
on the criticality of the outcome and probable impact of incorrect disposition.
Document
and Correct
The
final step is to determine lessons learned from the MSA and document any changes to the test procedure. If the evalu-
ation indicates the test procedure needs to be improved, these improvement projects should be undertaken as soon as pos-
sible.
Measurement System Scorecard
12
3
4
567
8910
87900
00
000 24
22
100
00
000 5
01
000
00
000 1
30
6
4
3
Total tests
# of testers
Total
Tester
Results
Good parts
Bad parts
Dispositioned
Correctly
Good and
Rejected
Bad and
Accepted
Measurement System Effectiveness
Criteria
Result Conclusion
80.0
27.8
8.3
Test effectiveness (%)
Probability of false rejects
(%)
Probability of false
acceptance (%)
Marginal
Needs improvement
Needs improvement
January
2003 Users Guide
5

Measurement Systems Analysis For Binary Data
Test Effectiveness Calculator
Version 1.0, August 2002
Introduction
Welcome to the Measurement Precision Calculator. This utility is intended to
perform the calculations for Measurement Precision Studies as described
in the IPC test method IPC-TM 1.8.
This unility is useful for situations where the measurement data is recorded
in binary format,, such as pass/fail or go/no-go.
Please refer to the test method before beginning the measurement precision study.
The test method defines the terms and equations used in detail.
Refer to the User Guide for further detailed instructions.
This workbook includes the following
- A blank spreadsheet to enter measurements
- A spreadsheet with example data
- A form for manual data entry, if desired.
The test data should be entered into the yellow areas on the
data entry spreadsheet. Code results as "A" and "R".
This is a beta version of this software.
Your comments and suggestions would be appreciated.
If you have any questions, please contact:
1
Scope
Tests
performed on presumably identical samples
under seemingly identical conditions do not always yield iden-
tical results. This is due in part to errors inherent in every
measurement. During the development of a new test proce-
dure or use of an existing test procedure, this variability must
be understood and precautions taken to ensure that it is con-
trolled to within necessary limits. Performance of this test
method will help to estimate measurement error and trouble-
shoot possible causes. It can provide evidence that a new test
procedure is suitable for use when submitted for review, or an
existing test procedure is capable of measuring the applicable
parameter.
This method provides a simple, easy to use, standard proce-
dure for determining the precision of a test method using the
average and range method. It can be used on tests that
involve measurements that yield continuous data. The calcu-
lations shown in this procedure are streamlined versions; use-
ful for situations where up to five repeated readings are taken
on each of up to 10 samples by up to 10 test laboratories,
operators or test conditions.
This procedure is not useful for measurements which result in
binary data, such as pass-fail or go-no go results, or where
more than five repeated measurements or more than ten labo-
ratories or conditions are used. These situations are covered
under other methods. (see 6.3)
1.1
Definitions
Accuracy
(Bias) –
The
difference between an observed
measurement and the true (but perhaps unknown) value being
measured (see Figure 1).
Continuous
Data –
Numerical
data that can take any con-
ceivable value within an observed range and forms a distribu-
tion about a mean value.
Precision
–
The
closeness to each other of repeated mea-
surements of the same quantity.
Repeatability
–
Variation
of a measurement system that is
obtained by repeating measurements on the same sample(s)
by the same procedure under the same measurement condi-
tions (see Figure 1).
Reproducibility
–
Variation
among the averages of measure-
ments made under different measurement conditions such as
different
operators, equipment, and/or locations (see Figure 1).
Resolution
–
The
size of the smallest increment on the mea-
surement instrument under examination. This value is fre-
quently used in the advertising literature to classify the instru-
ment.
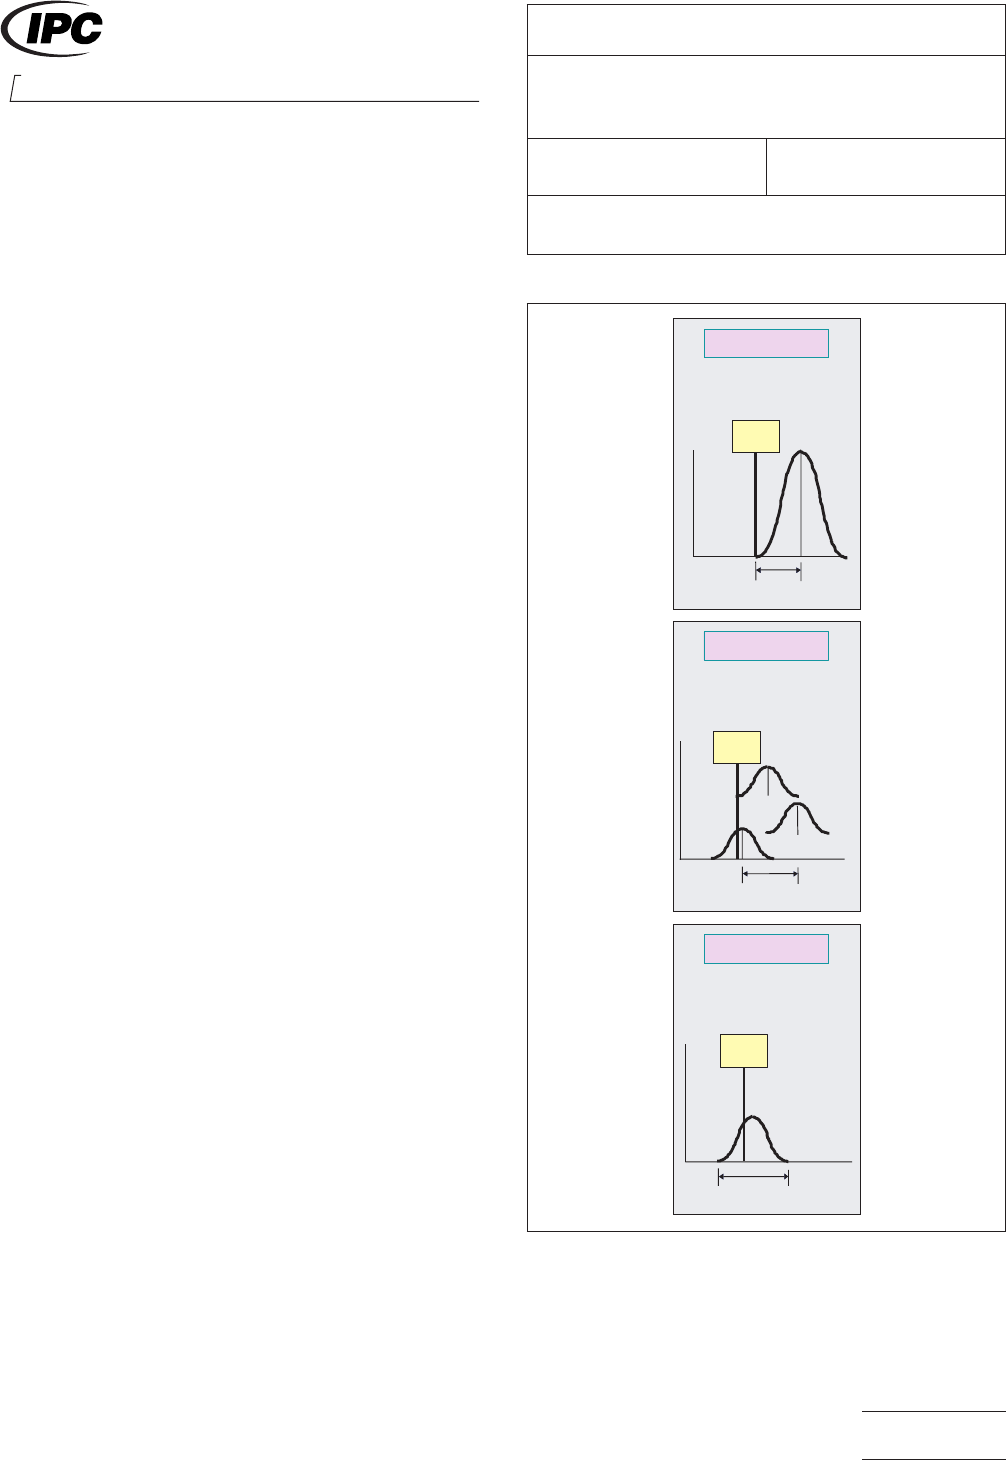
IPC-19-1
Figure
1 Measurement Repeatibility and Reproducibility
Repeatibility
Reproducibility
Accuracy
Accuracy
Reproducibility
Repeatibility
How close is the
measurement to the
true value?
True
value
How close are a series of
measurements by several
people on the same part on
the same equipment?
True
value
True
value
How close is a series of
measurements on one
part by one person?
Operator A
Operator C
Operator
B
2215
Sanders Road
Northbrook, IL 60062-6135
IPC-TM-650
TEST METHODS MANUAL
Number
1.9
Subject
Measurement
Precision Estimation for Variables
Data
Date
01/03
Revision
A
Originating Task Group
Measurement Precision Task Group (7-11a)
Material
in this Test Methods Manual was voluntarily established by Technical Committees of IPC. This material is advisory only
and its use or adaptation is entirely voluntary. IPC disclaims all liability of any kind as to the use, application, or adaptation of this
material. Users are also wholly responsible for protecting themselves against all claims or liabilities for patent infringement.
Equipment referenced is for the convenience of the user and does not imply endorsement by IPC.
P
age1of10
ASSOCIATION CONNECTING
ELECTRONICS INDUSTRIES
®